HU Jiashu
I am a PhD student at Purdue University working across remote sensing, international relations, and construction engineering management. My research uses satellite Earth observation — radar interferometry, night-time lights, multispectral and thermal imagery — to monitor infrastructure in conflict zones and other places no one can visit, and to turn what the ground is doing into evidence that policy and investment decisions can rely on. I am co-advised by Prof. Clark A. Cory and Prof. Liana Eustacia Reyes.
My technical training spans surveying engineering and art design (Nanjing Forestry University), geomatics with specialisation in photogrammetry, remote sensing, and computer vision (M.Sc., University of Stuttgart), and current doctoral work in construction management at Purdue, where I apply LLM-based reasoning and neural radiance fields to infrastructure inspection for the Indiana Department of Transportation. This engineering background grounds my policy thinking in hands-on technical fluency — I can read both a SAR backscatter map and a semiconductor supply-chain report.
I am a Graduate Research Fellow in the Law and Conflict (LAC) Lab in Purdue's Department of Political Science, and I also collaborate with the department's Governance and Responsible AI Lab (GRAIL) and work with scholars at the Chinese Academy of Social Sciences on comparative semiconductor industrial policy. I am an invited book reviewer for H-Diplo, contributing to scholarly discourse on Cold War geopolitics and East Asian international relations. I work across English, Chinese, and German, and bring a tri-national perspective (China, Germany, United States) to questions of technology competition and governance.
我是普渡大学的博士研究生,研究横跨遥感、国际关系与工程建设管理三个领域:利用卫星对地观测——雷达干涉测量、夜间灯光、多光谱与热红外影像——监测冲突地区及其他无法实地到访地区的基础设施,把地面正在发生的变化转化为政策与投资决策可以依靠的证据。我由 Clark A. Cory 教授与 Liana Eustacia Reyes 教授联合指导。
我的技术训练横跨测绘工程与环境艺术设计(南京林业大学)、以摄影测量、遥感和计算机视觉为方向的大地测量学硕士(斯图加特大学),以及目前在普渡大学的工程管理博士研究,其间将大语言模型推理与神经辐射场技术应用于印第安纳州交通部的基础设施检测项目。这一工程技术背景为我的政策思考提供了扎实的技术基础——我既能解读SAR后向散射图,也能分析半导体供应链报告。
我是普渡大学政治学系法律与冲突实验室(LAC)的研究员,同时与该系的治理与负责任AI实验室(GRAIL)合作,并与中国社会科学院的学者共同研究比较半导体产业政策。我还是H-Diplo的特邀书评人,参与冷战地缘政治与东亚国际关系的学术讨论。我使用英语、中文和德语三种语言开展工作,以跨越中国、德国和美国的三国视角审视技术竞争与治理问题。
Research
研究
My research sits at the intersection of remote sensing, international relations, and construction engineering management. On the technical side, I build methods and software for satellite monitoring of infrastructure — radar interferometry, coherence change detection, night-time lights and multi-source data fusion — alongside applied work on AI-assisted infrastructure inspection. On the policy side, I ask what this evidence can and cannot establish about conflict, sovereignty and the governance of technology, and how it can inform decisions in places where no one can verify the ground in person.
我的研究位于遥感、国际关系与工程建设管理的交叉地带。技术方面,我开发用于基础设施卫星监测的方法与软件——雷达干涉测量、相干变化检测、夜间灯光与多源数据融合——同时继续从事 AI 辅助基础设施检测的应用研究。政策方面,我追问这些证据能够、以及不能够证明关于冲突、主权与技术治理的哪些事情,以及在无人能实地核查的地方,它们如何为决策提供依据。
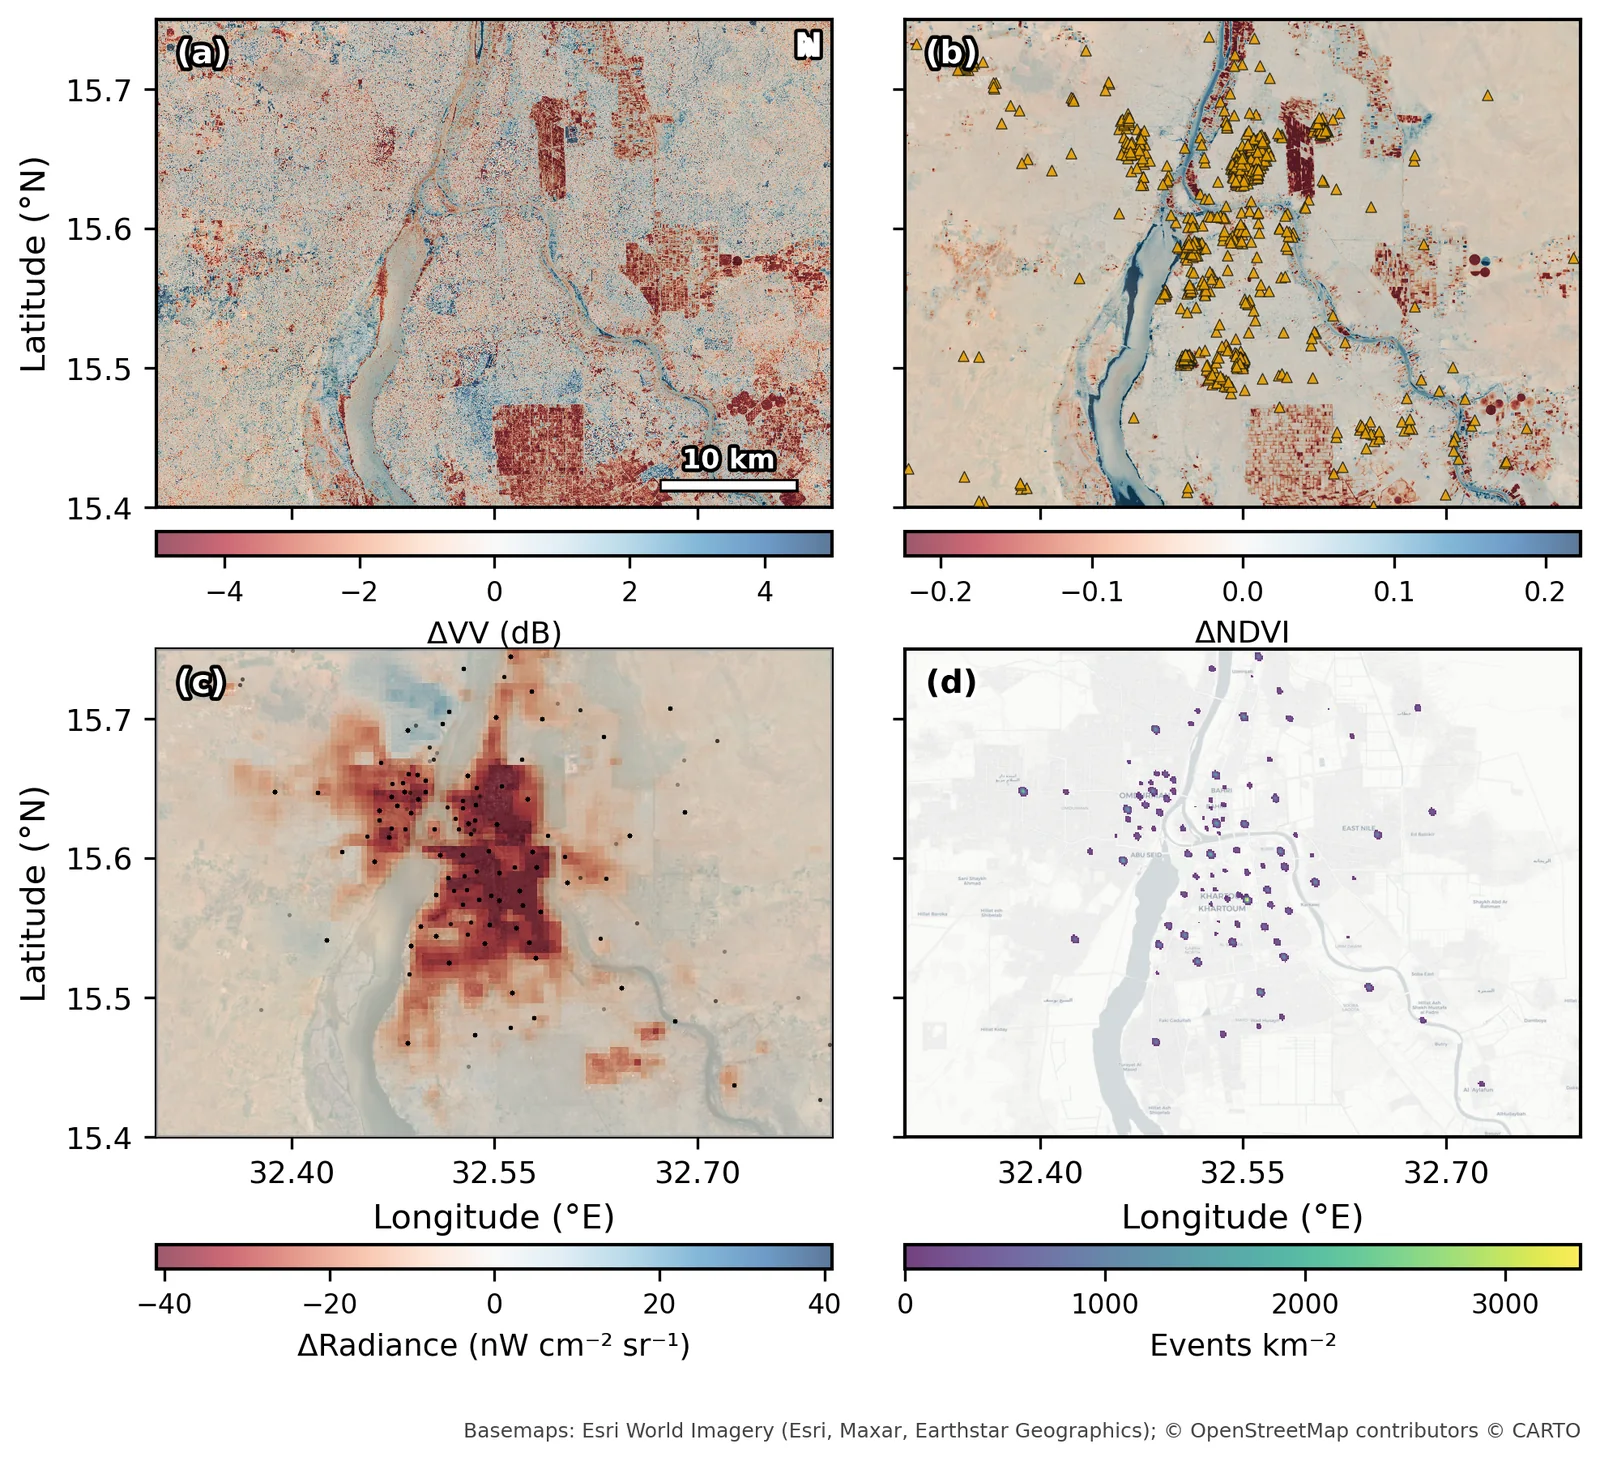
Satellite-Based Conflict Impact Assessment: Khartoum, 2023–2025
基于卫星遥感的冲突影响评估:喀土穆,2023–2025
Nine free data sources — radar, optical, night-time light, thermal, fire and conflict-event records — fused to measure what the war did to a city of five million. Night-time light fell by 65–67% and showed its first year-on-year recovery in late 2025; vegetation barely moved; and a formal test marks where pixel-scale damage attribution stops.
融合雷达、光学、夜间灯光、热红外、火点与冲突事件九类免费数据,测量战争对这座五百万人口城市造成的影响。夜间灯光下降 65–67%,并在 2025 年底首次出现同比回升;植被几乎未变;一项正式检验划出了像元级损毁归因的边界。
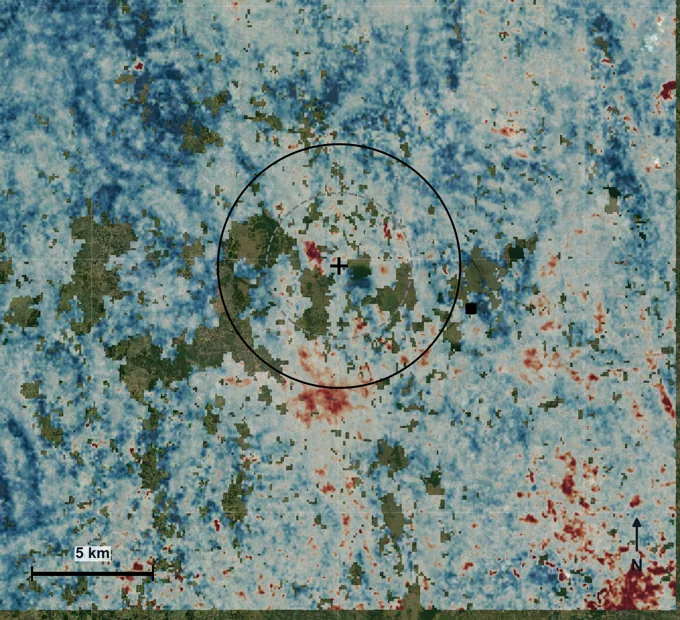
Independent Ground Evidence: Barapukuria, Bangladesh
独立的地面证据:孟加拉国 Barapukuria
A 123-date Sentinel-1 deformation record of a coal mine and power plant, co-registered with vegetation, surface temperature and night-time light on one 30 m grid. The cross-check points away from the mine and toward dry-season groundwater pumping as the dominant regional signal — stated as a consistent chain of evidence, not as proof.
为一座煤矿与电厂建立 123 期 Sentinel-1 地表形变记录,并与植被、地表温度和夜间灯光配准到同一个 30 米网格。多源交叉检验显示,区域性沉降的主导信号指向旱季抽取地下水灌溉,而不是煤矿本身——这是一条一致的证据链,而非定论。
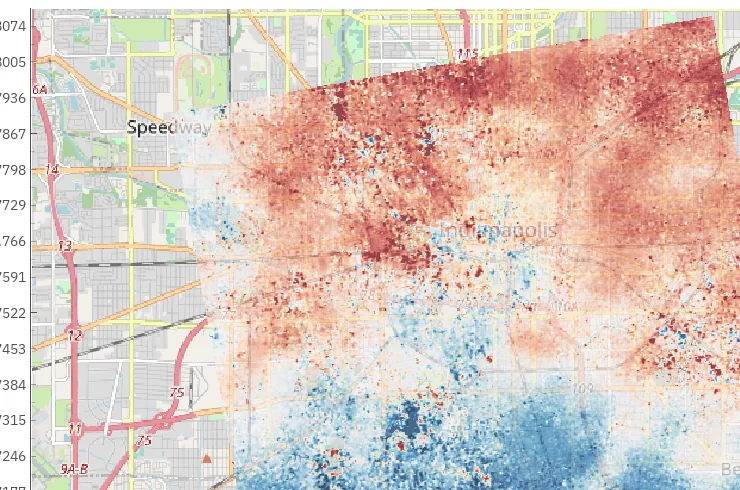
Bosar: Open SAR Interferometry for Windows and macOS
Bosar:面向 Windows 与 macOS 的开源雷达干涉测量工具箱
A desktop application that packages the whole InSAR chain — data search, native Sentinel-1 coregistration, interferometry, unwrapping, atmospheric correction, SBAS and PS/DS time series — into one installable program with optional GPU acceleration. Started for conflict-damage monitoring with coherence change detection.
一个桌面应用,把完整的 InSAR 处理链——数据检索、Sentinel-1 原生配准、干涉、解缠、大气校正,以及 SBAS 与 PS/DS 时间序列——打包成一个可直接安装的程序,并可选用 GPU 加速。最初为基于相干变化检测的冲突损毁监测而开发。
LLM-Based Bridge Inspection
Applying large language models to bridge condition assessment for the Indiana Department of Transportation. Developing natural language interfaces for querying 3D structural data, enabling inspectors to interact with point cloud and sensor data through conversational queries.
UAV-Based Bridge Surveying and 3D Reconstruction
Drone-based surveying and photogrammetric 3D reconstruction of bridge structures for the Indiana Department of Transportation. Integrated UAV platforms with LiDAR and photogrammetry pipelines for construction management and infrastructure monitoring applications.
Quality of Photogrammetric Cameras: Image Resolution and Blur Compensation
Investigated spatial resolution and image quality of photogrammetric camera systems using Modulation Transfer Function (MTF) analysis. Compared Bayer pattern and Foveon sensor architectures, and evaluated the efficiency of Vexcel Imaging's Adaptive Motion Compensation (AMC) for airborne photogrammetry. Supervised by Dr.-Ing. Michael Cramer.
Writing
写作
Policy commentary, book reviews, and public-facing analysis on technology governance, semiconductor geopolitics, and the social dimensions of global competition.
政策评论、书评与面向公众的分析,聚焦技术治理、半导体地缘政治与全球竞争的社会维度。
I write policy commentary on semiconductor geopolitics, technology governance, and the institutional design of R&D ecosystems.
我撰写关于半导体地缘政治、技术治理与研发生态系统制度设计的政策评论。
Curriculum Vitae
个人简历
Education
Research & Work Experience
Publications & Writing
Profiles
Skills & Languages
Satellite-Based Conflict Impact Assessment:
Multi-Source Remote Sensing Analysis of the Khartoum Metropolitan Region
基于卫星遥感的冲突影响评估:
喀土穆大都会区多源遥感综合分析
On 15 April 2023, war broke out in Khartoum between the Sudanese Armed Forces (SAF) and the Rapid Support Forces (RSF). Ground access closed; satellites kept watching. This study fuses nine free data sources — Sentinel-1 SAR, Sentinel-2 optical imagery, VIIRS night-time lights, MODIS vegetation indices, Landsat surface temperature, NASA FIRMS active fires, ACLED and UCDP conflict events, and OpenStreetMap buildings — to measure what the war did to a city of five million people, and to say clearly where free data stops. All satellite processing runs in Google Earth Engine and all event processing in Python, with no commercial imagery and no field data.
2023年4月15日,苏丹武装部队(SAF)与快速支援部队(RSF)在喀土穆爆发战争。地面通道随即关闭,但卫星仍在观测。本研究融合九类免费数据源——Sentinel-1 合成孔径雷达、Sentinel-2 光学影像、VIIRS 夜间灯光、MODIS 植被指数、Landsat 地表温度、NASA FIRMS 火点、ACLED 与 UCDP 冲突事件,以及 OpenStreetMap 建筑物——测量这场战争对一座五百万人口城市造成的影响,并清楚说明免费数据能走到哪里为止。全部卫星处理在 Google Earth Engine 中完成,事件数据处理在 Python 中完成,不使用商业影像,也没有实地数据。
Key Findings
主要发现
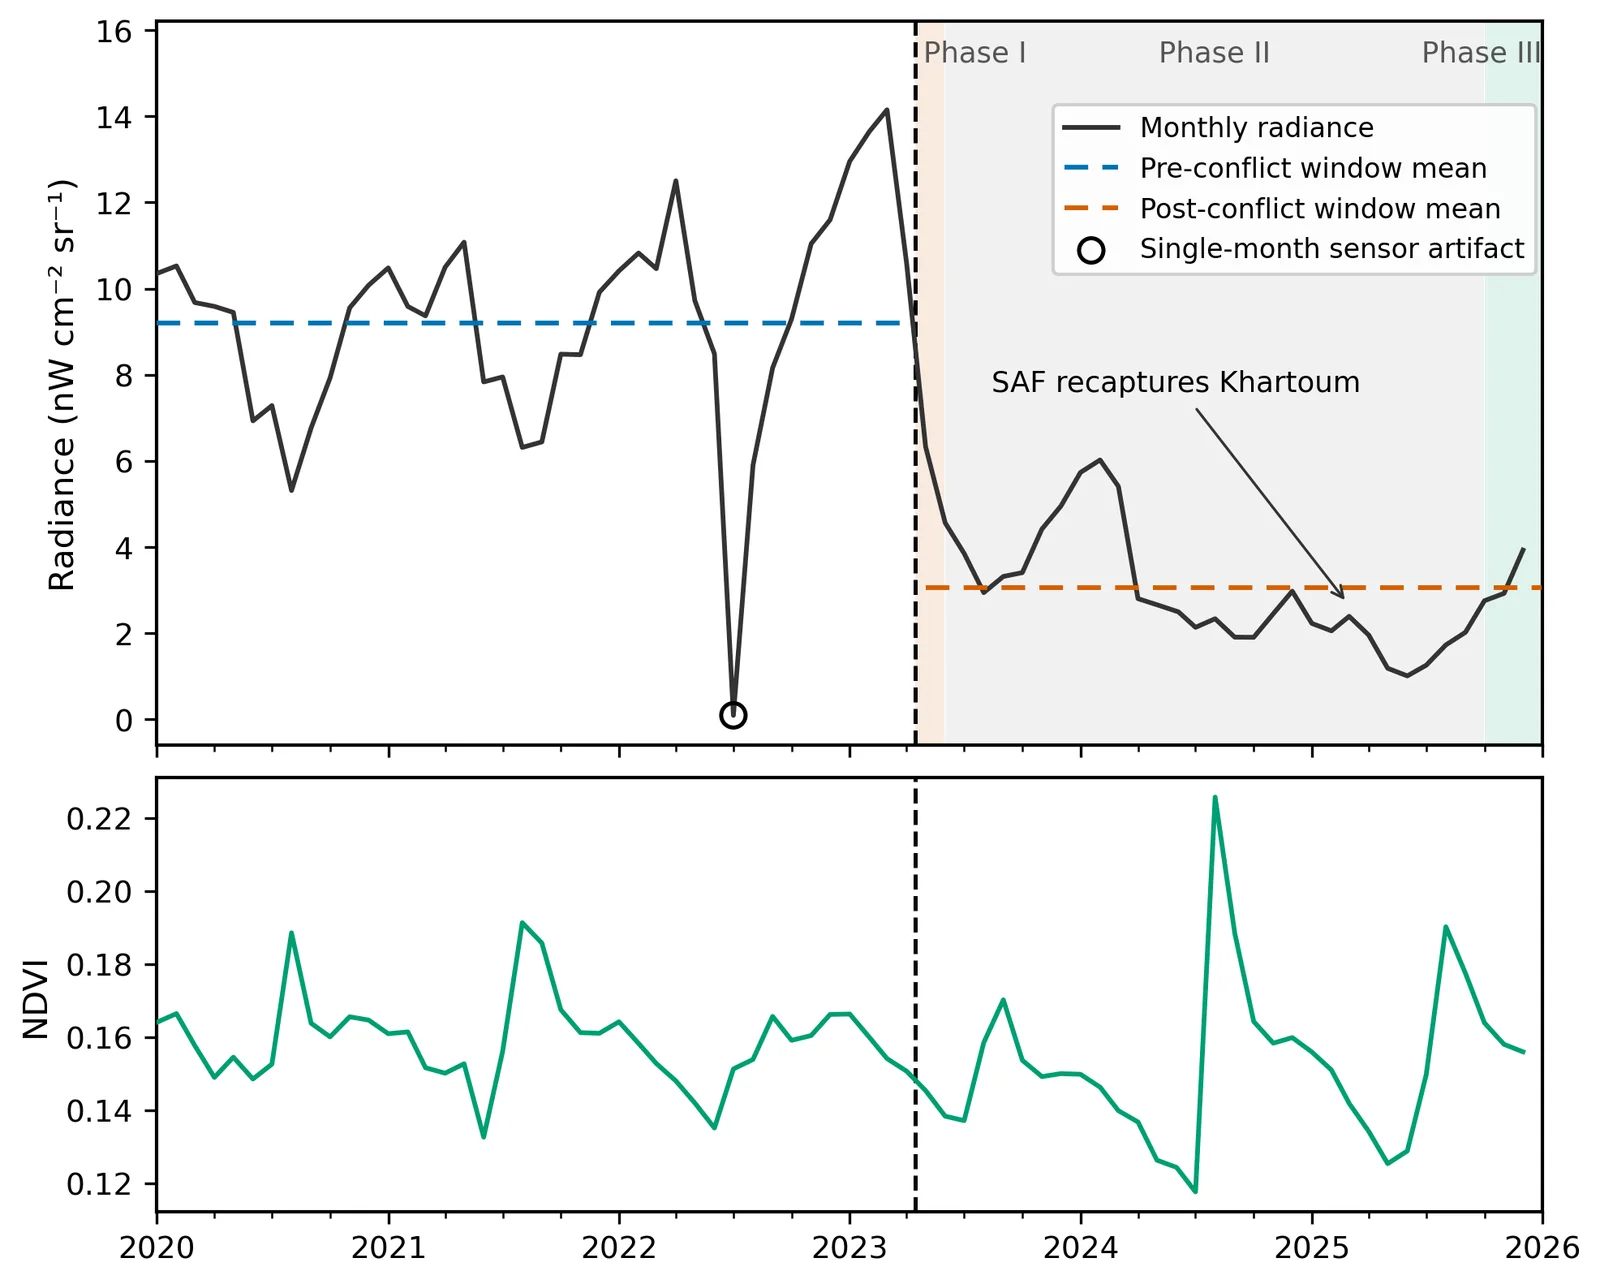
- Night-time light fell by 65–67% and stayed down, in three phases: a 40% crash in the first month, a slow further decline into mid-2025, and a first year-on-year upturn in October–December 2025, after the SAF retook the city. December 2025 was still about 66% below December 2022.
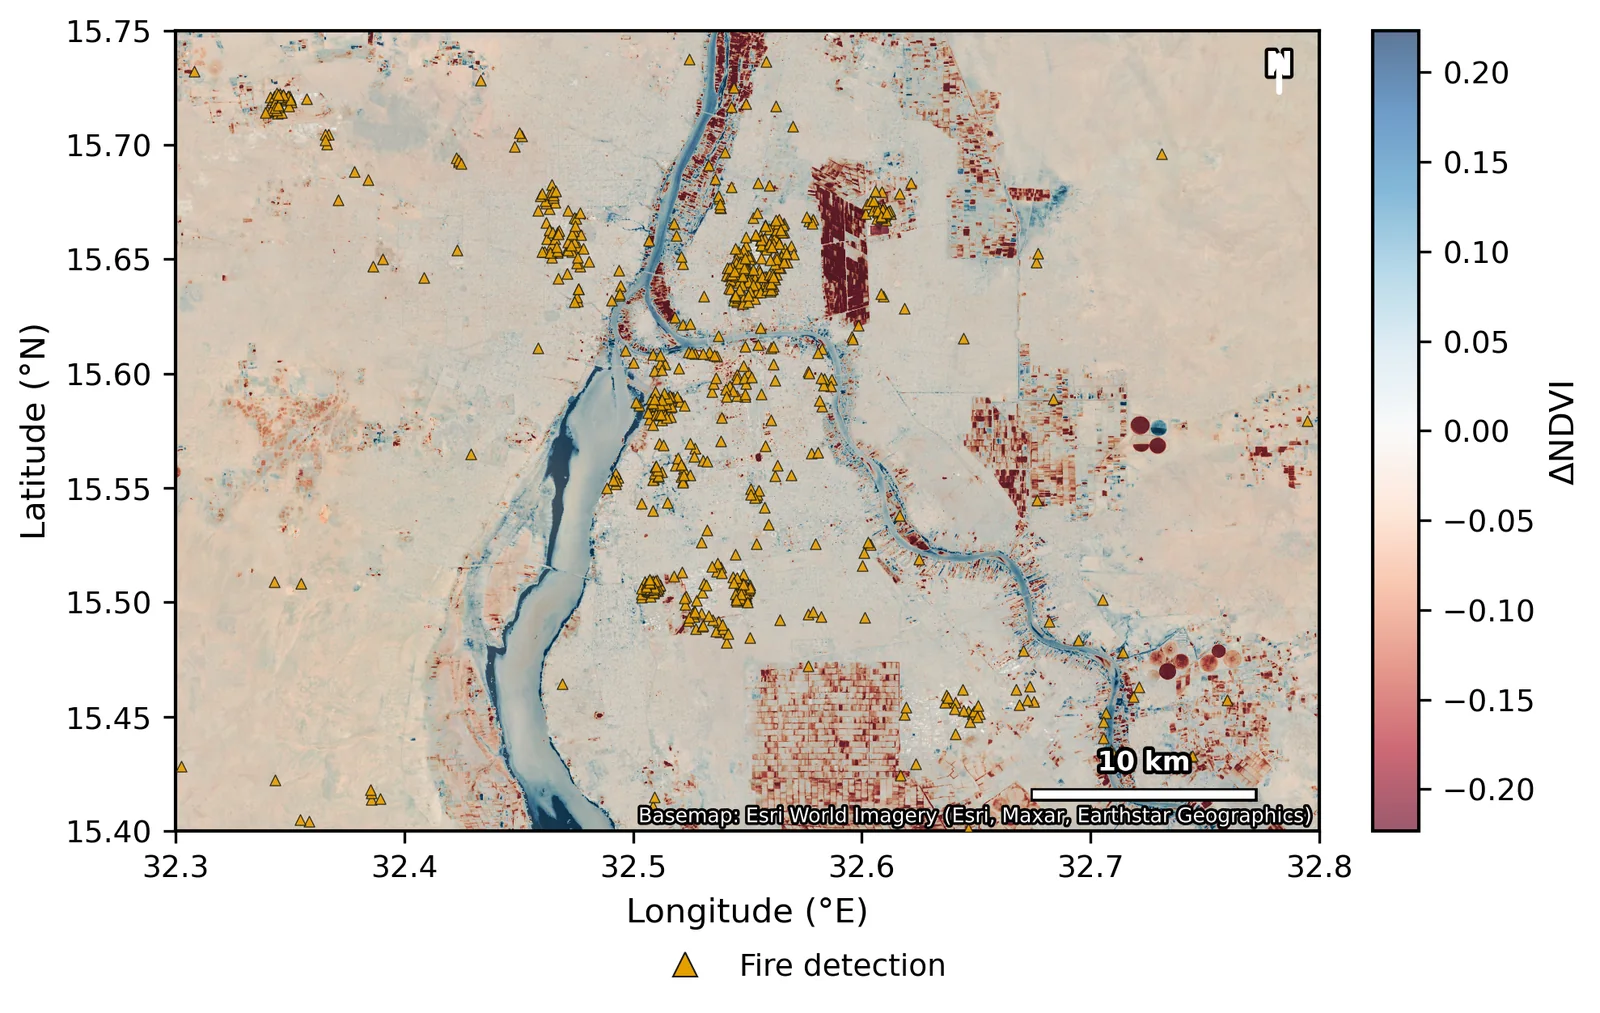
- Vegetation barely moved: the area-mean NDVI change is −0.009 and the seasonal cycle ran through the war. Decline concentrates in 8.4% of the area, mostly along the Nile farm belt. Lights and vegetation decoupled.
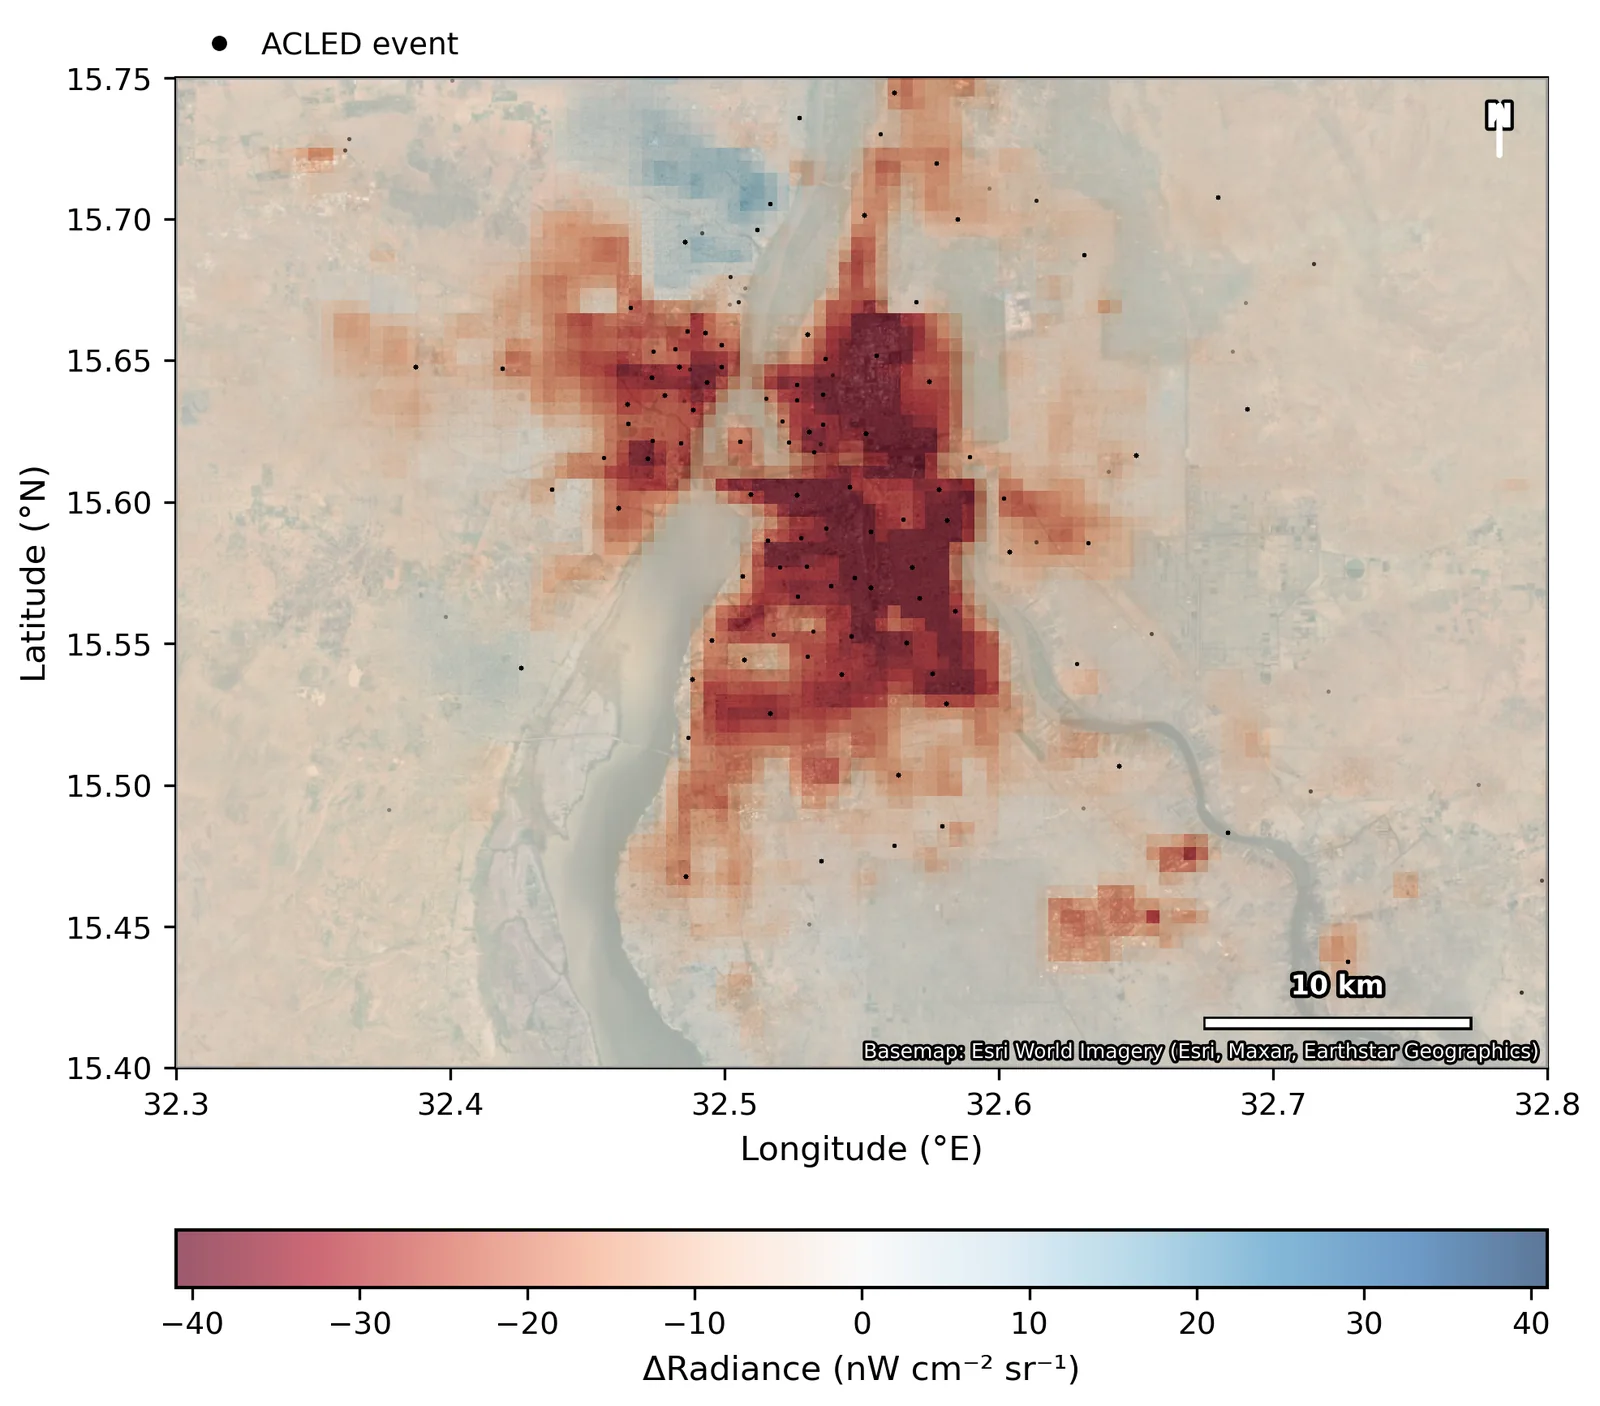
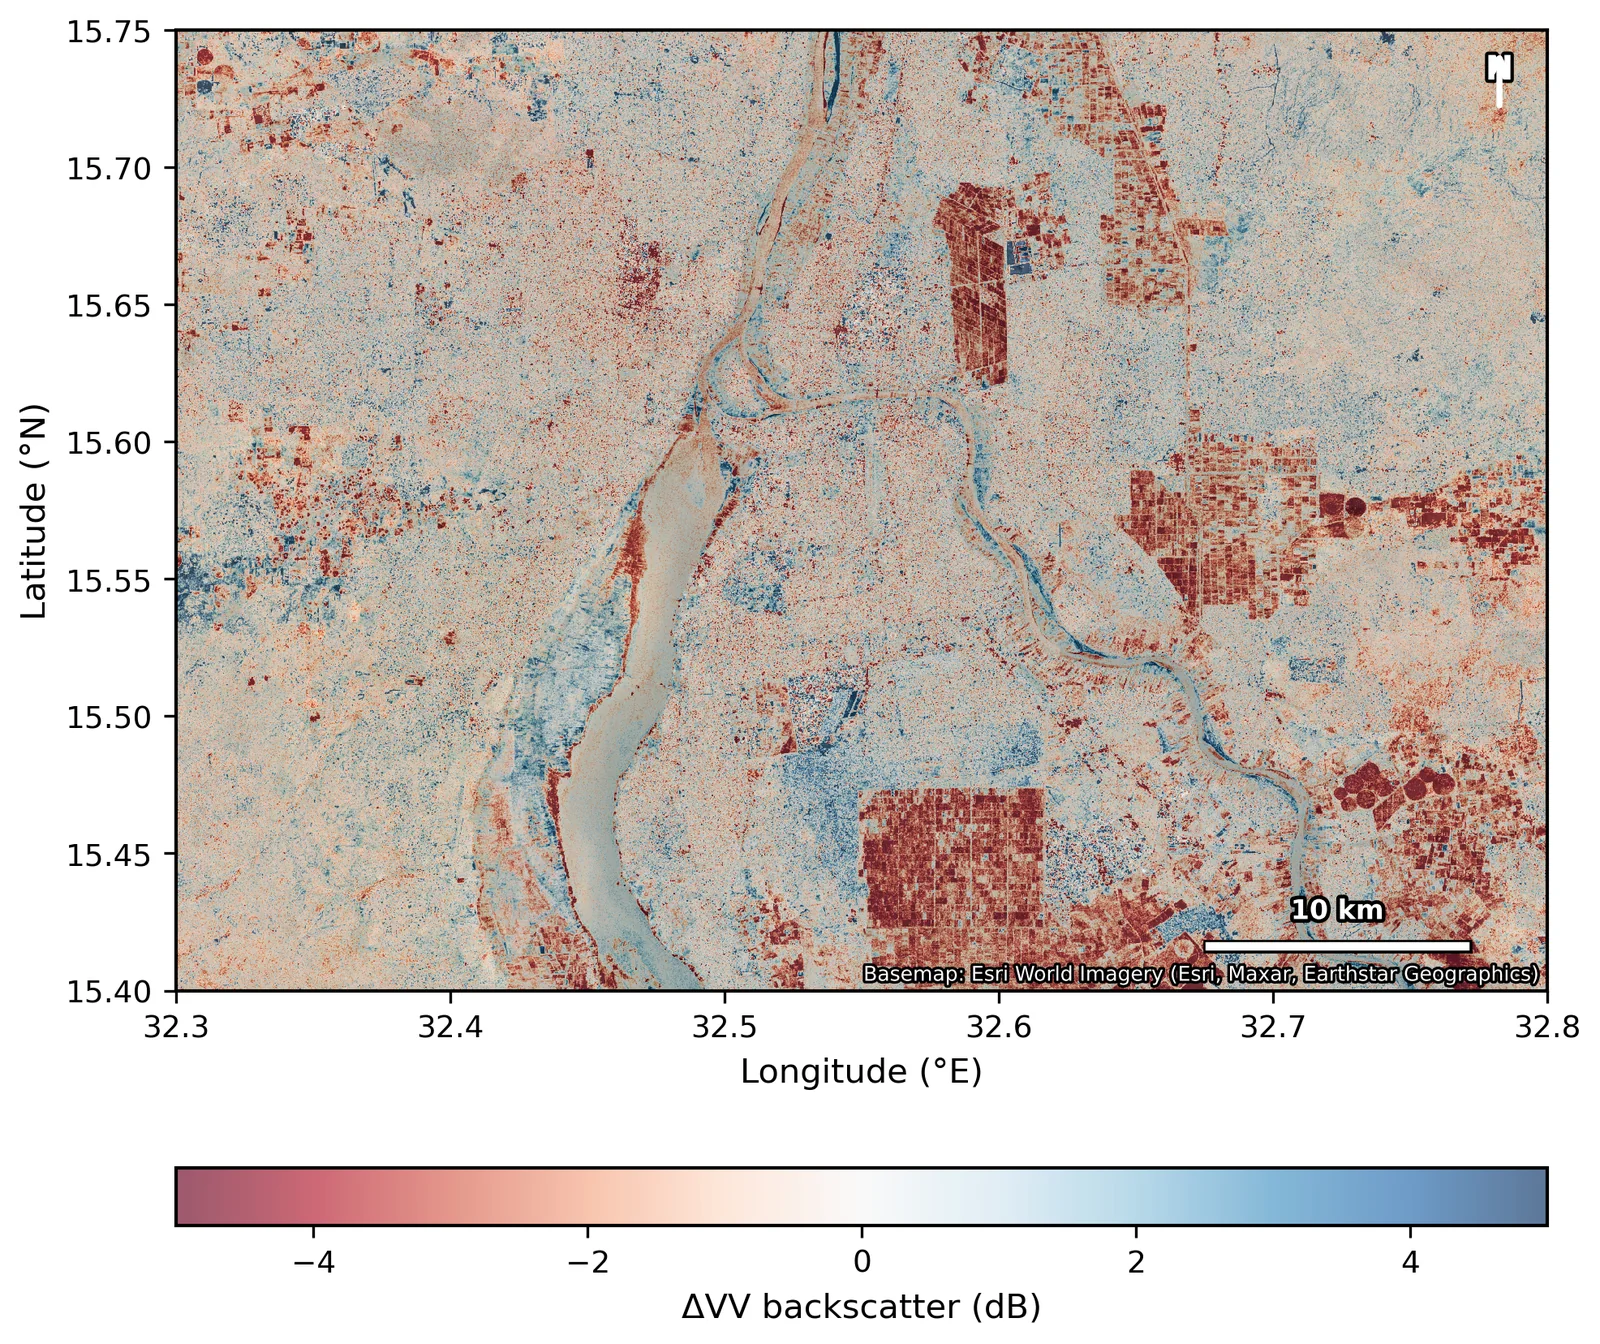
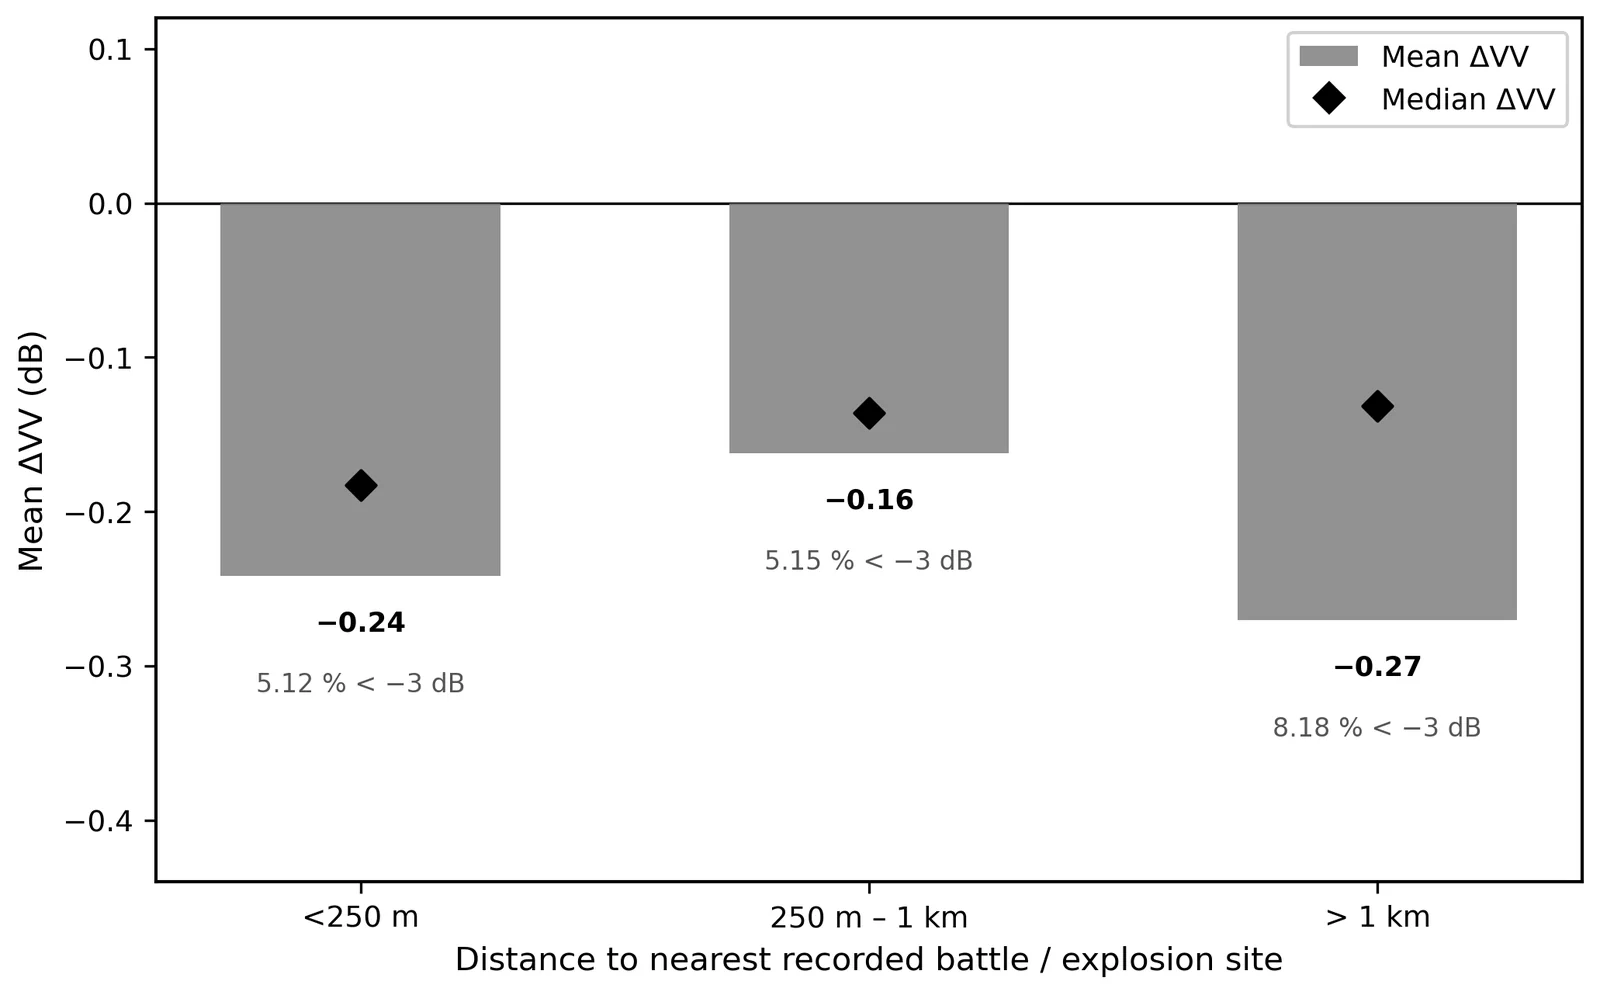
- Radar backscatter fell by more than 3 dB over 7.8% of the area, a pattern consistent with structural damage — but a distance-stratification test finds no significant concentration of the loss near recorded battle sites (p = 0.56), so pixel-scale attribution is not claimed.
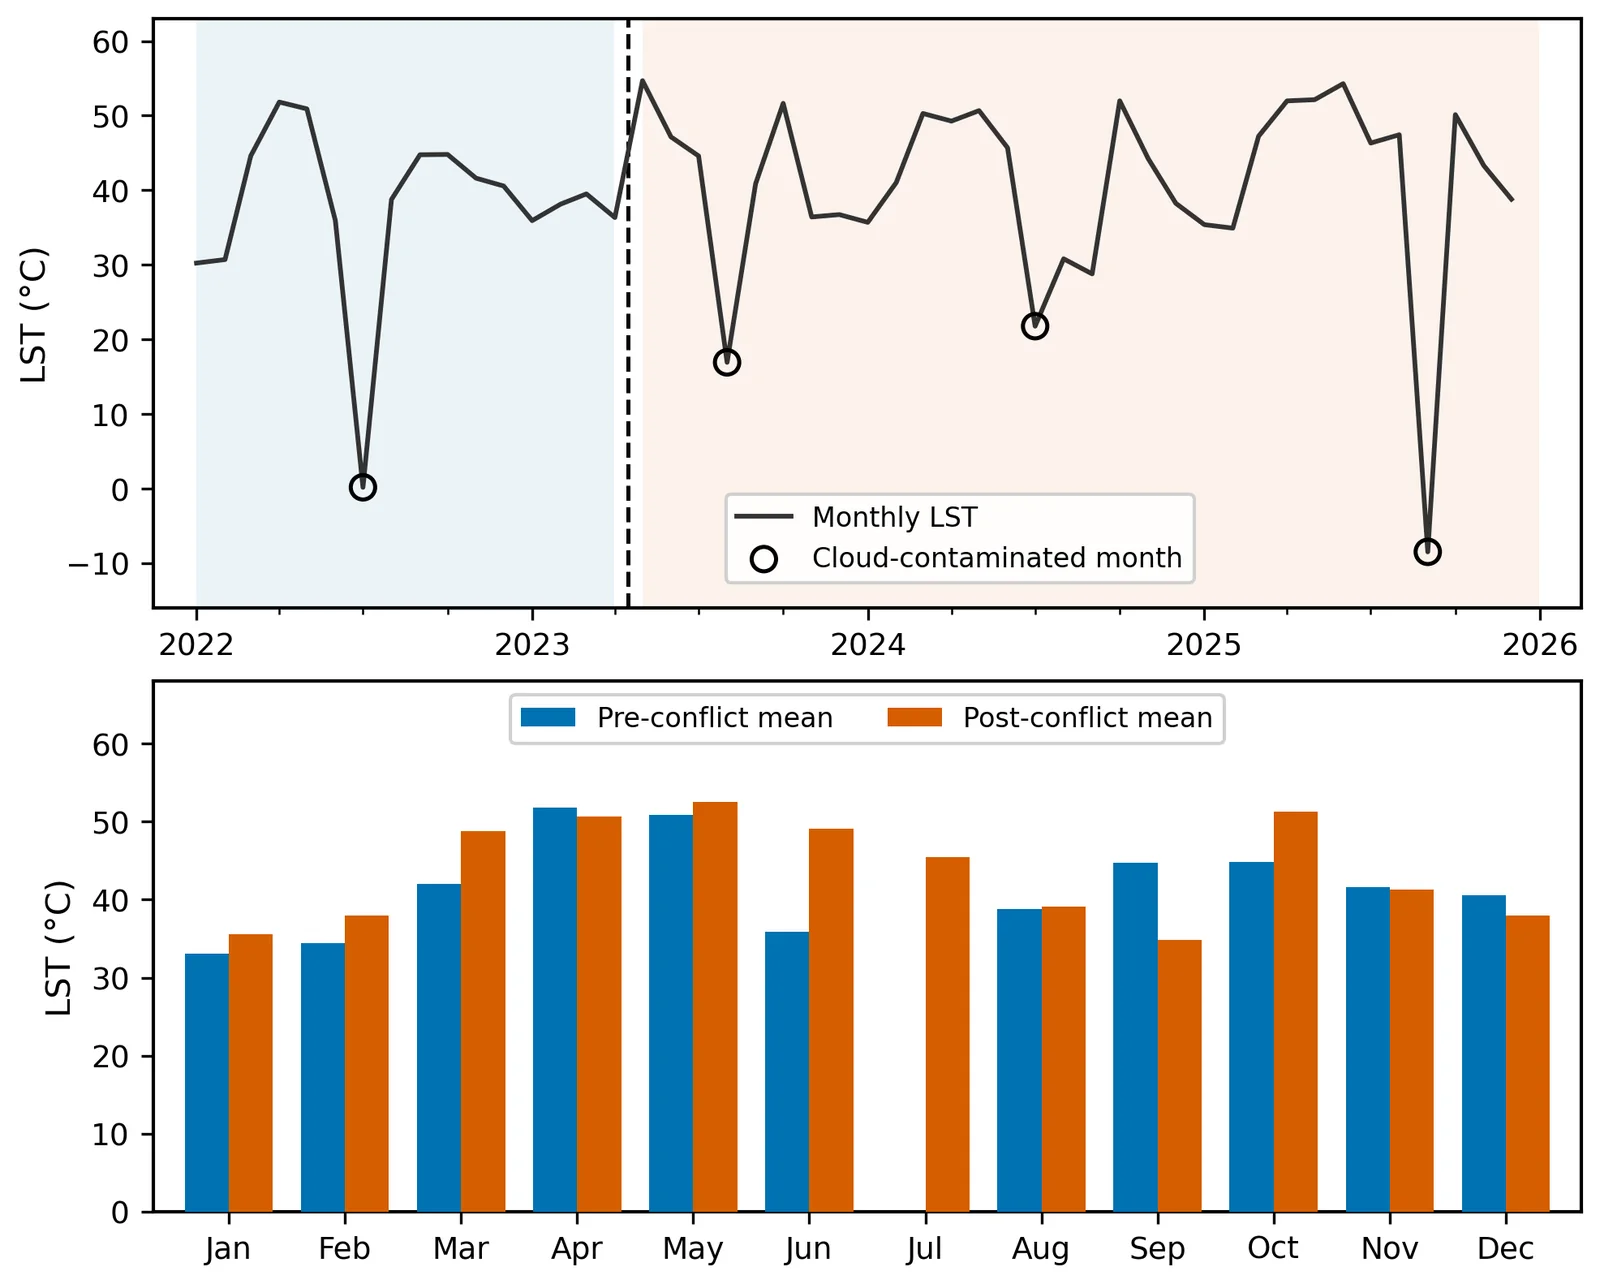
- Seasonally matched land surface temperature rose by 2.5 to 3.0 °C; the raw window difference (+6.3 °C) is roughly half seasonal artefact.
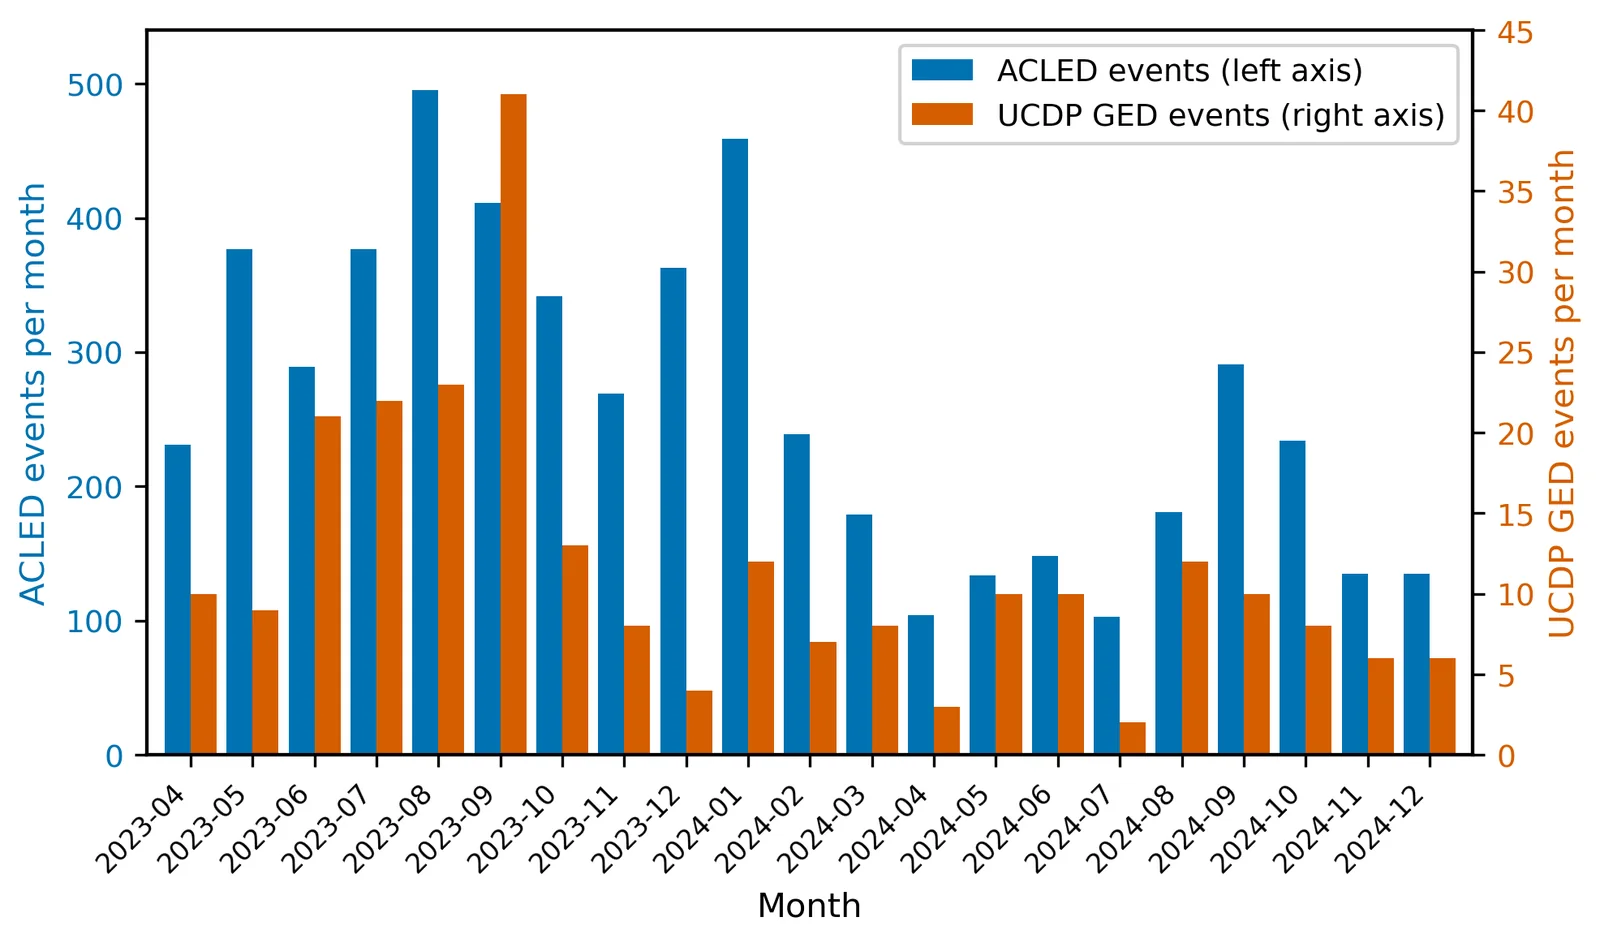
- ACLED and UCDP disagree on scale (5,496 vs 245 events in the aligned window) yet agree on the monthly rhythm of the war (r = 0.60).
- 夜间灯光下降 65–67% 并持续低迷,呈现三个阶段:开战首月骤降 40%;随后缓慢下滑至 2025 年年中;在政府军收复首都之后,2025 年 10–12 月首次出现同比回升。即便如此,2025 年 12 月仍比 2022 年同月低约 66%。
- 植被几乎没有变化:全区 NDVI 平均变化仅 −0.009,季节周期贯穿整个战争期间。下降集中在 8.4% 的面积上,主要位于尼罗河沿岸农业带。灯光与植被出现脱钩。
- 雷达后向散射在 7.8% 的面积上下降超过 3 dB,与结构性损毁的特征一致;但按距离分层的检验显示,这种下降并未显著集中在有记录的交战地点附近(p = 0.56),因此不做像元级的损毁归因。
- 按季节匹配后,地表温度上升 2.5 至 3.0 °C;未经匹配的两窗口直接相减(+6.3 °C)大约一半是季节造成的假象。
- ACLED 与 UCDP 在规模上相差悬殊(对齐时间窗内分别为 5,496 起和 245 起事件),但在战争的月度节奏上一致(r = 0.60)。

Night-time light is the most human of the satellite signals: electricity, commerce, occupancy. Over Khartoum it fell by two thirds and stayed down, while the vegetation along the Nile kept its seasonal rhythm — the 2024 green-up was even the strongest in the record. The war switched off the city and left the river-fed ecosystem running. Read alone, vegetation indices would have graded this catastrophe as mostly stable.
夜间灯光是卫星信号中最能反映人类活动的一种:电力、商业、人口居住。喀土穆的夜间灯光下降了三分之二并一直没有恢复,而尼罗河沿岸的植被却保持着季节节律——2024 年的返青甚至是整个记录中最强的。战争关掉了城市,却让依河而生的生态系统照常运转。如果只看植被指数,这场灾难会被判定为“基本稳定”。
Radar is the usual instrument for structural damage, but here it hit a hard limit. Sentinel-1 had no coverage of the study area between January 2023 and March 2025, so the only comparison is a 2021 baseline against 2025, and everything that happened in between — fighting, demolition, farm cycles, soil moisture — lands in one difference image. A formal test asked whether backscatter loss concentrates near recorded fighting. It does not, and I report that null with the same prominence as the significant results. The radar map is therefore described as consistent with structural damage, and the next step is coherence-based methods.
雷达本是评估结构损毁的常用手段,但在这里遇到了硬性限制。2023年1月至2025年3月间,Sentinel-1 对研究区没有任何覆盖,只能拿 2021 年的基线与 2025 年对比;期间发生的一切——交战、拆除、农作周期、土壤湿度变化——都叠加在同一张差值图里。我用一项正式检验来回答:后向散射的下降是否集中在有记录的交战地点附近?答案是否定的,而我把这个零结果与显著结果放在同样醒目的位置报告。因此,雷达变化图只被表述为“与结构性损毁一致”,下一步需要基于相干性的方法。
Vegetation decline concentrates in 8.4% of the area, mostly irrigated blocks along the Nile — the pattern a collapse of farm management would produce. Fires and vegetation loss are co-located in the same districts but not correlated (p = 0.10). Surface temperature rose by 2.5 to 3.0 °C once months are matched by season; the naive window difference of 6.3 °C is roughly half seasonal artefact.
植被下降集中在 8.4% 的面积上,主要是尼罗河沿岸的灌溉地块——这正是农业管理崩溃会留下的格局。火点与植被损失出现在同样的街区,但两者并不相关(p = 0.10)。按季节匹配月份后,地表温度上升 2.5 至 3.0 °C;简单的两窗口相减得到的 6.3 °C 约有一半是季节假象。
Satellites see effects; event data name causes. ACLED records 6,018 events and 8,845 fatalities in the study area between April 2023 and March 2025. Compared over the same window, ACLED and UCDP differ 22-fold in scale yet agree on the monthly rhythm of the war: the levels reflect counting rules, the timing reflects the war. Because ACLED snaps its 6,018 events onto 127 reference coordinates, every spatial claim here stops at the district scale.
卫星看到的是后果,事件数据说明的是原因。2023年4月至2025年3月,ACLED 在研究区记录了 6,018 起事件、8,845 人死亡。在同一时间窗内比较,ACLED 与 UCDP 的规模相差 22 倍,但对战争月度节奏的刻画一致:数量反映的是计数规则,时间节奏反映的是战争本身。由于 ACLED 把 6,018 起事件归并到 127 个参考坐标上,本文的所有空间结论都止于街区尺度。
The layers agree at the district scale; the attribution of individual pixels does not hold. Everything here runs on free data and is built to transfer to other cities no one can visit.
各数据层在街区尺度上彼此印证,但单个像元的归因并不成立。整套流程完全基于免费数据,可以迁移到其他无法实地到访的城市。
Independent Ground Evidence:
Open Satellite Monitoring at the Barapukuria Coal–Power Complex, Bangladesh (2020–2023)
独立的地面证据:
孟加拉国 Barapukuria 煤电综合体的开放卫星监测(2020–2023)
Much of the world's critical infrastructure stands where no open, continuous ground record exists. Whether a mine is subsiding, whether a power plant is running, and how hard the aquifer beneath the surrounding farmland is being pumped are questions that communities, regulators, insurers and investors all need answered — and in data-sparse regions the only answers usually come from the operator. This sample asks whether open satellite data alone can support physical judgments about one asset that are reproducible and able to withstand scrutiny.
世界上许多关键基础设施所在的地方,都没有公开、连续的地面记录。一座矿是否在沉降、一座电厂是否在运转、周边农田下的含水层被抽取得有多厉害——社区、监管者、保险方和投资者都需要知道答案,而在数据稀缺地区,答案通常只能来自运营方自己。这个样本要回答的是:仅凭公开卫星数据,能否对一项具体资产作出可复现、经得起检验的物理判断。
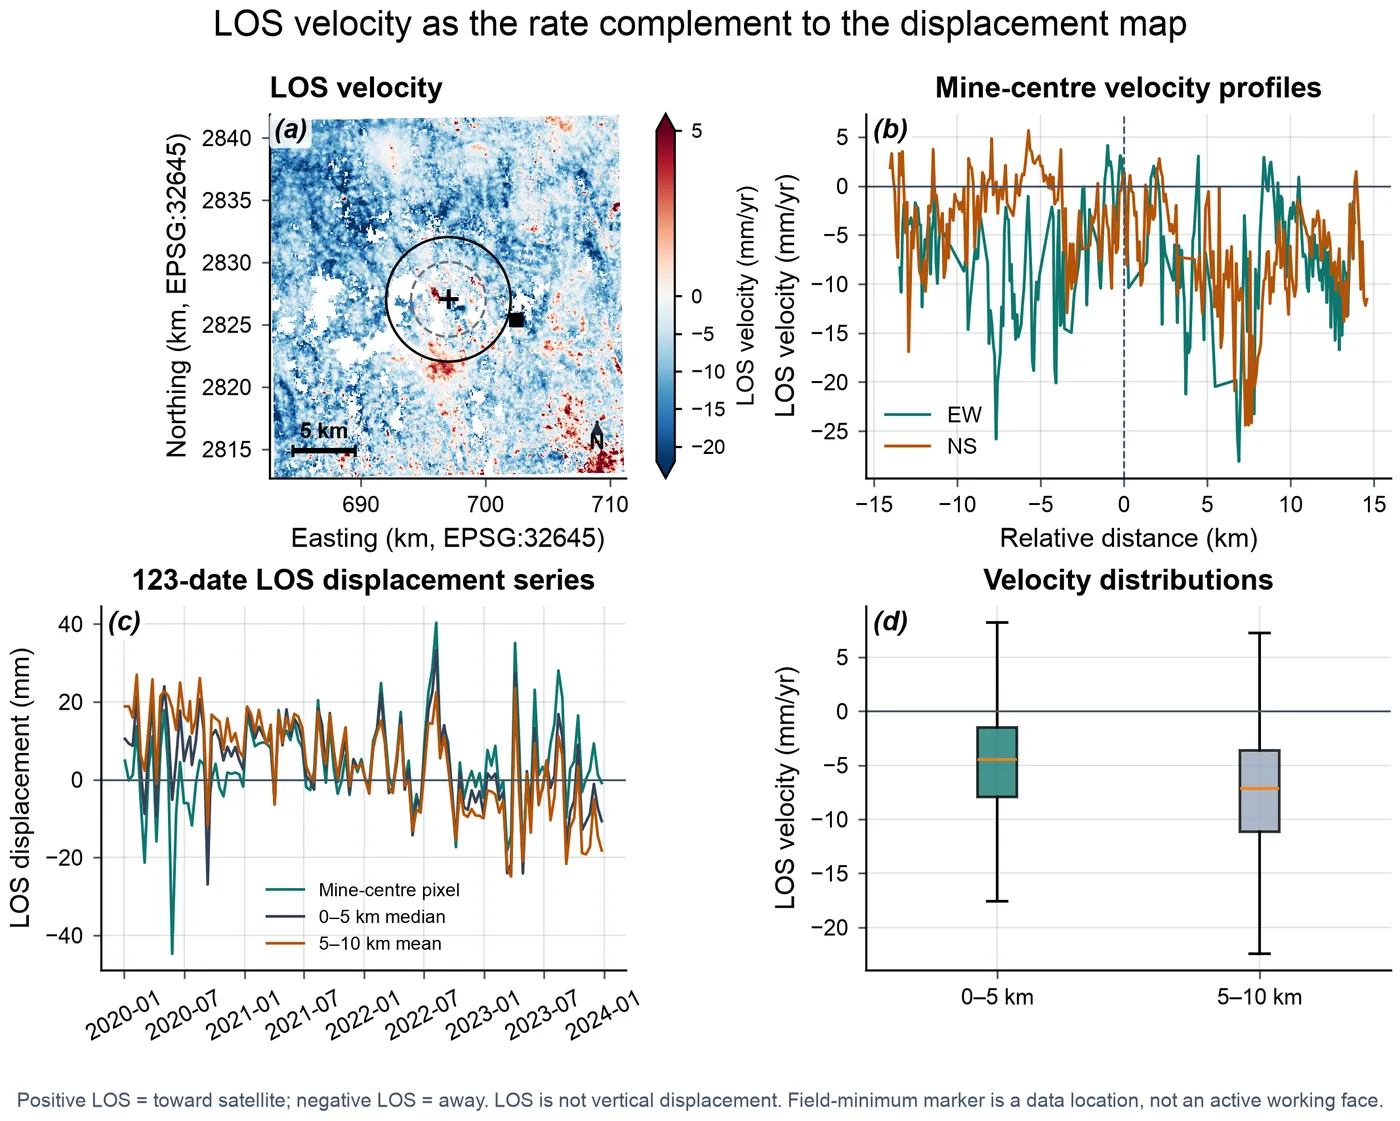
Barapukuria, in northwestern Bangladesh, is the country's only operating coal mine and sits beside a 525 MW coal-fired power plant, in one of the most intensively irrigated farming regions of South Asia. For 2020–2023 I inverted 243 Sentinel-1 interferograms from ascending track 114, by small-baseline time-series analysis, into a 123-date record of line-of-sight ground deformation corrected with ERA5 meteorology, and co-registered it with Sentinel-2 vegetation, Landsat surface temperature and VIIRS night-time lights on one 30 m grid: four independent physical measurements of the same ground, aligned pixel by pixel.
Barapukuria 位于孟加拉国西北部,是该国唯一在产的煤矿,旁边是一座 525 兆瓦的燃煤电厂,所在地区是南亚灌溉强度最高的农业区之一。针对 2020–2023 年,我用小基线时间序列方法,把升轨 114 的 243 个 Sentinel-1 干涉图反演为 123 个时相的视线向地表形变记录,并用 ERA5 气象数据做了校正;再把它与 Sentinel-2 植被、Landsat 地表温度和 VIIRS 夜间灯光配准到同一个 30 米网格上——对同一片地面的四种相互独立的物理测量,逐像元对齐。
Key Findings
主要发现
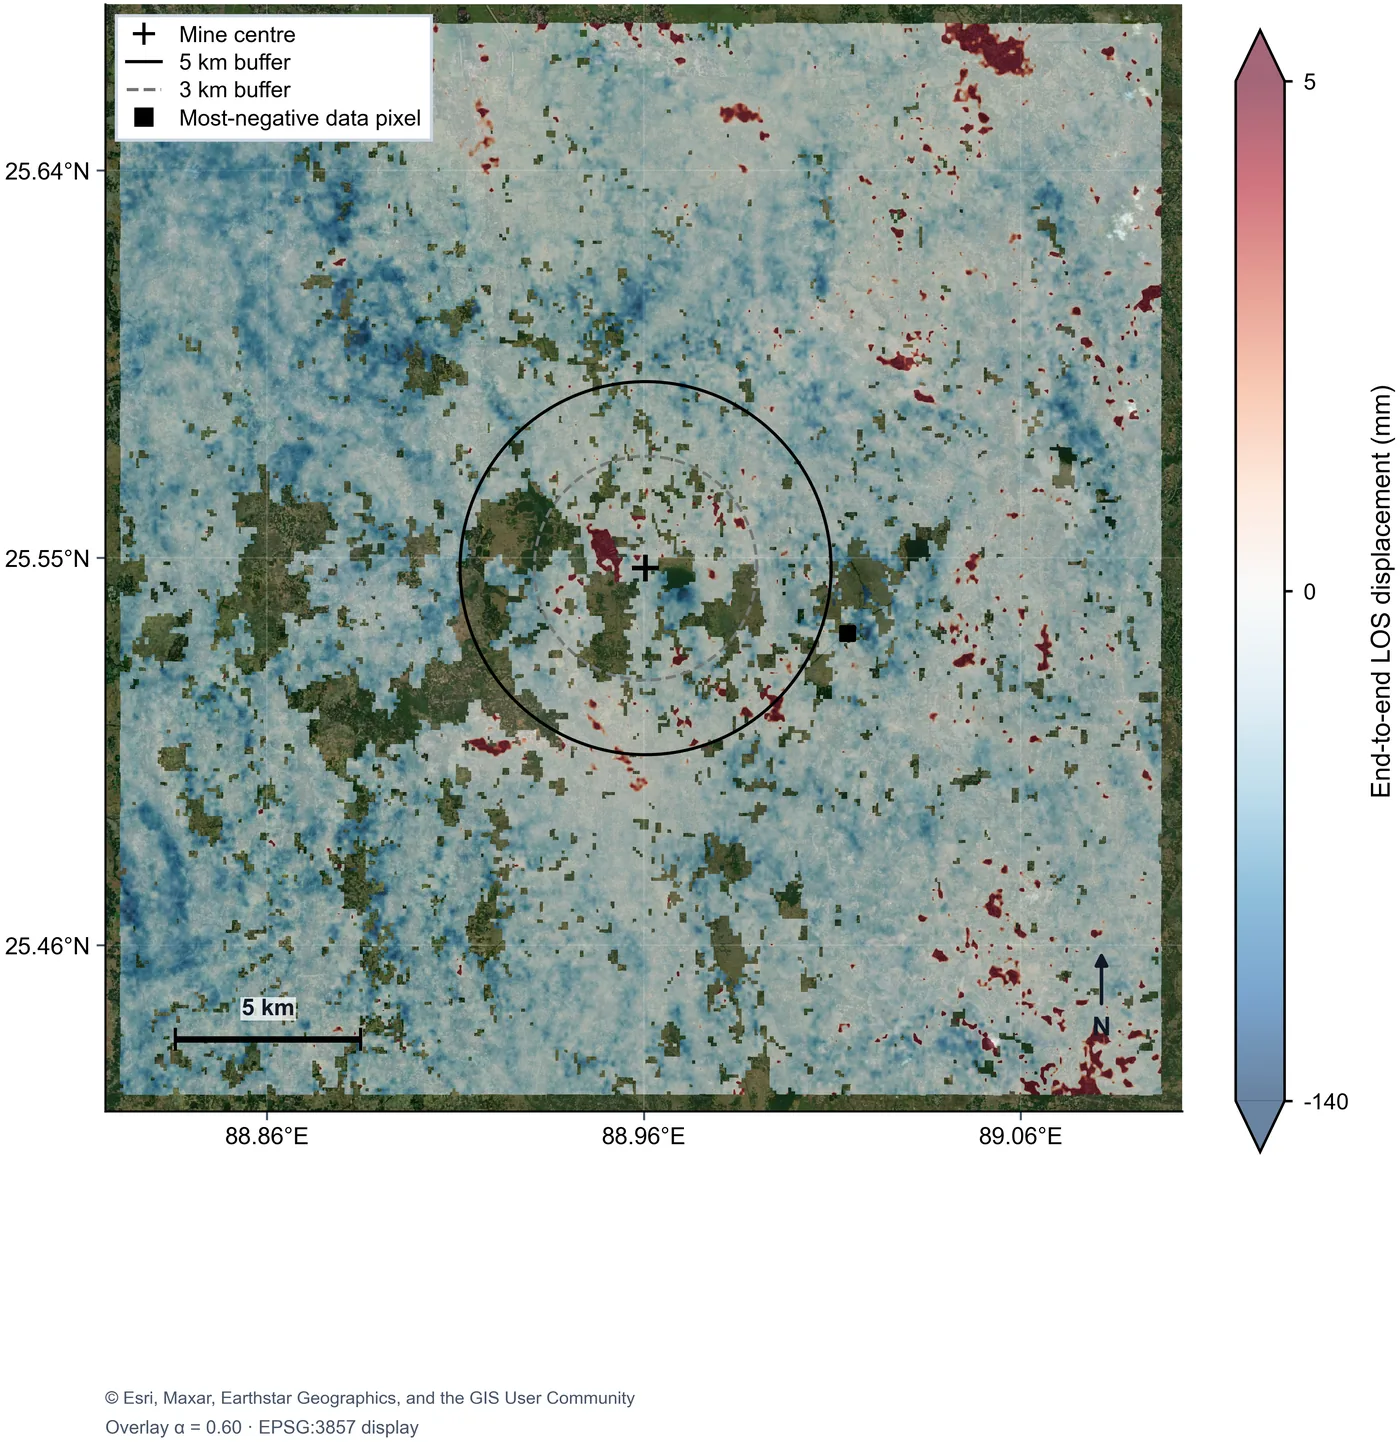
- Subsidence is widespread: the regional median line-of-sight velocity is about −6.4 mm/yr, and cumulative displacement reaches about −181.5 mm (roughly 18 cm) over 2020–2023, deepest in farmland south-west of the mine.
- The pattern is not mine-centred: the 5 km zone around the mine subsides at a median −4.48 mm/yr, slower than the 5–10 km background ring at −7.17 mm/yr.
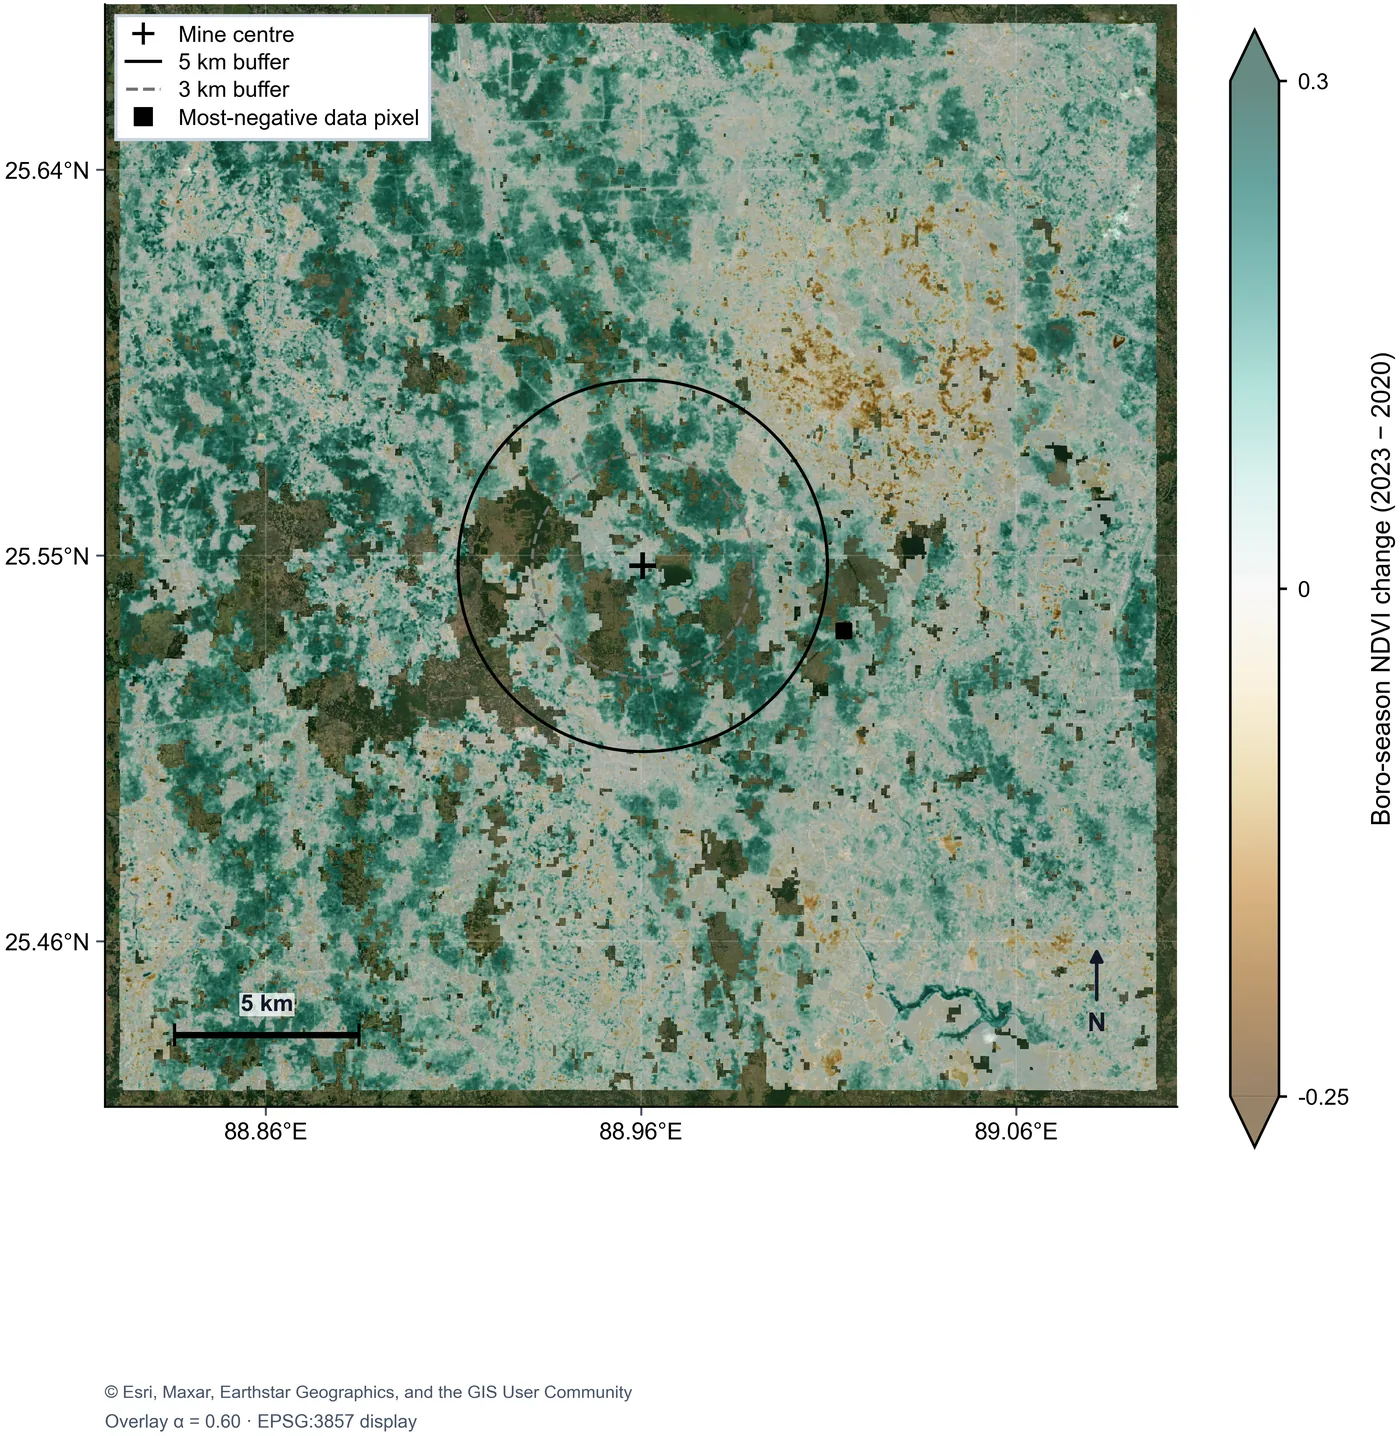
- Across about 790,000 jointly valid pixels, deformation correlates with dry-season greening (r = −0.22: the more a pixel greened, the faster it sank) and with surface-temperature change (r = +0.23), and hardly at all with night-time lights (r = +0.03).
- Reading: consistent with dry-season groundwater pumping for Boro rice as the dominant regional driver. This is a consistent chain of evidence, not proof: the correlations are weak, and pixel counts this large overstate statistical significance.
- Limits: line-of-sight motion is not vertical motion; C-band phase decorrelates over the fast, metre-scale trough above the longwall panels, so the mine's own subsidence (field maxima of 5.8 m) is under-measured; absolute calibration awaits ground control.
- 沉降范围很广:区域视线向速度中位数约为 −6.4 毫米/年,2020–2023 年累计形变最大约 −181.5 毫米(约 18 厘米),最深处位于煤矿西南方向的农田。
- 形变格局并不以煤矿为中心:煤矿周边 5 公里范围内的速度中位数为 −4.48 毫米/年,反而慢于 5–10 公里背景环带的 −7.17 毫米/年。
- 在约 79 万个共同有效像元上,形变与旱季返青相关(r = −0.22:返青越明显,下沉越快),与地表温度变化相关(r = +0.23),与夜间灯光几乎无关(r = +0.03)。
- 解读:结果与“旱季为种植 Boro 水稻抽取地下水是区域沉降的主导因素”相一致。这是一条一致的证据链,而非定论:相关性较弱,而且像元数量如此之大会夸大统计显著性。
- 局限:视线向形变不等于垂直形变;在长壁开采工作面上方快速形成的米级沉降槽中,C 波段相位会失相干,因此煤矿自身的沉降(实地测得最大 5.8 米)被低估;绝对标定仍需地面控制点。
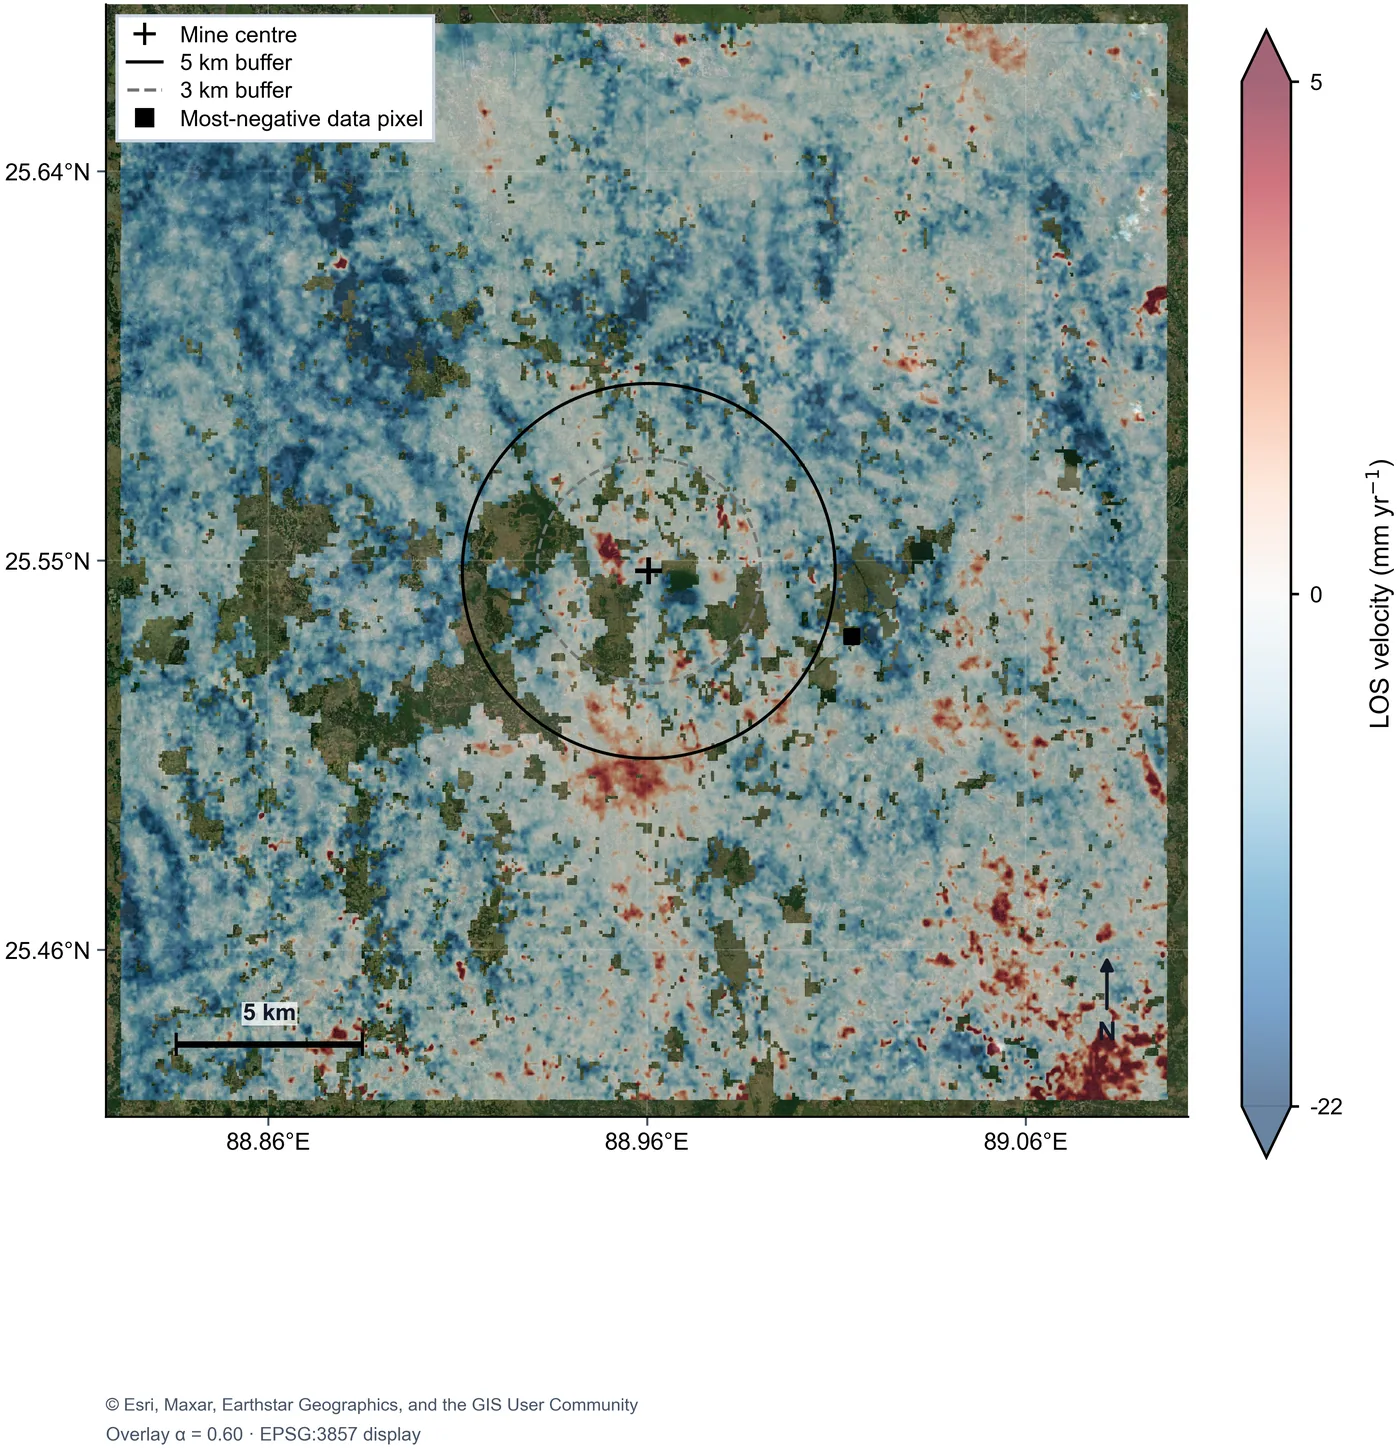
The map already poses the question that runs through the sample: what is moving this ground? The suspicion in a mining region falls on the mine, but this region has a second suspect. Bangladesh's dry-season Boro rice is irrigated almost entirely from groundwater, and persistent over-pumping compacts the aquifer system and lowers the surface. Depletion itself is invisible, but it leaves two footprints a satellite can see: the ground sinks, and the irrigated area greens.
这张图已经提出了贯穿整个样本的问题:是什么在让这片地面下沉?在矿区,人们首先怀疑煤矿,但这里还有第二个嫌疑对象。孟加拉国旱季的 Boro 水稻几乎全靠地下水灌溉,长期超采会压实含水层系统,使地表下降。地下水亏空本身看不见,却会留下卫星可见的两个痕迹:地面下沉,灌溉区变绿。
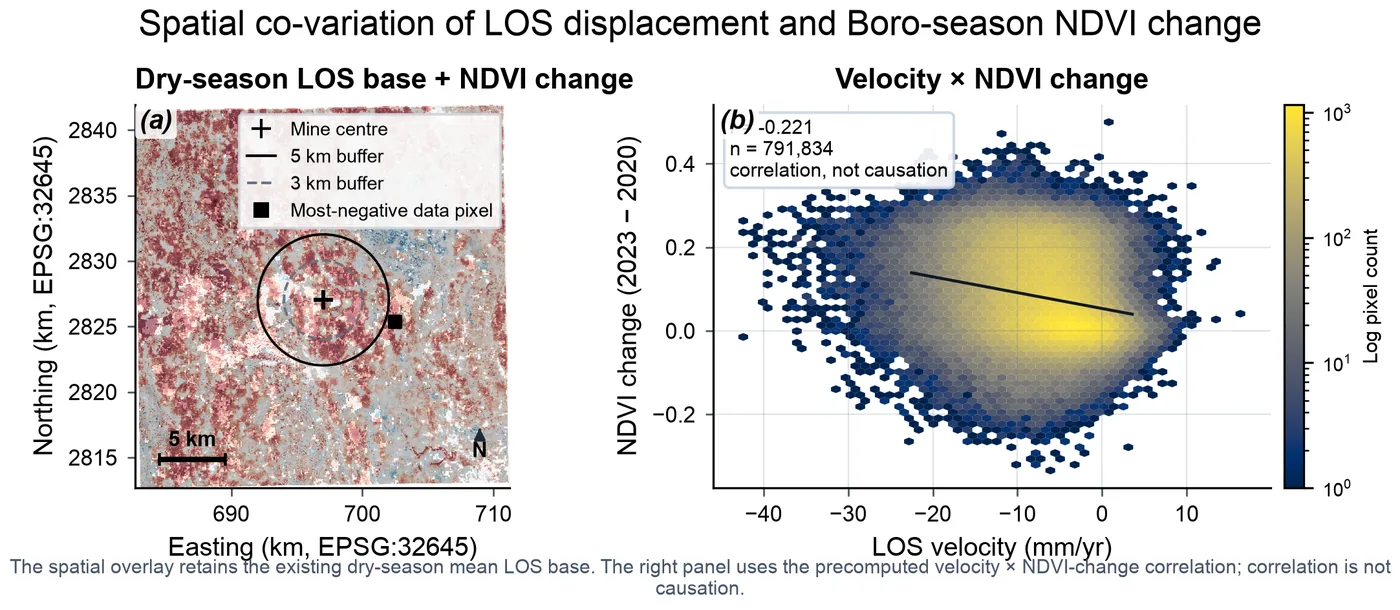
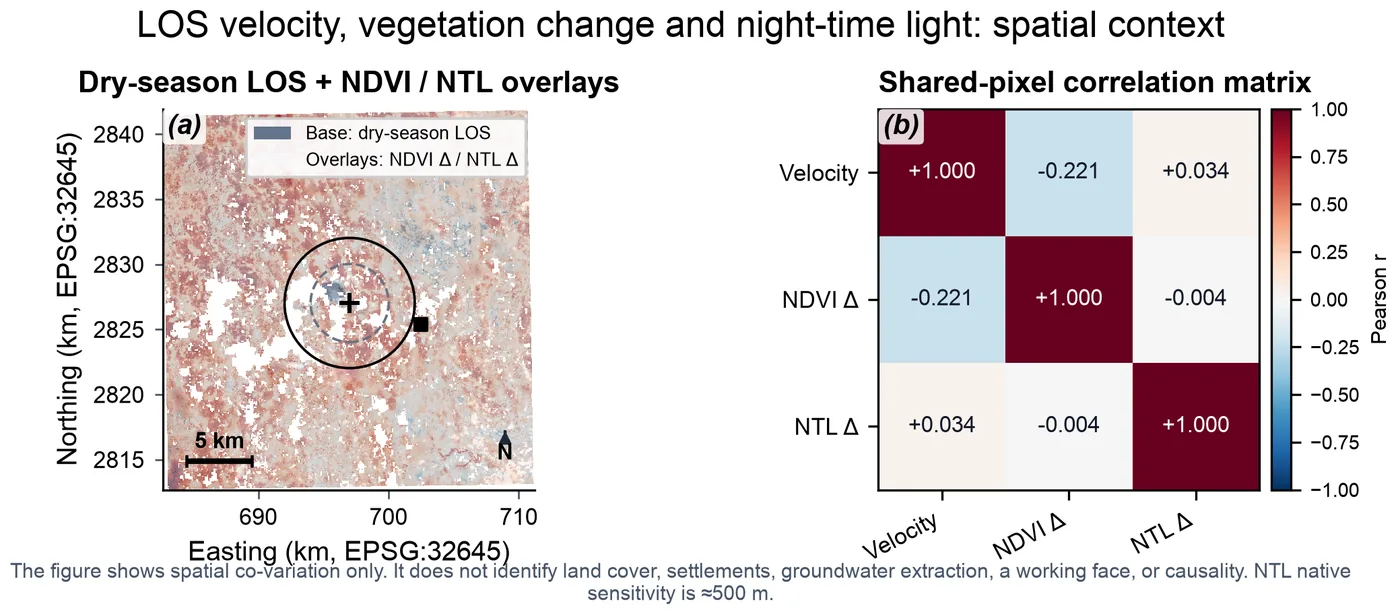
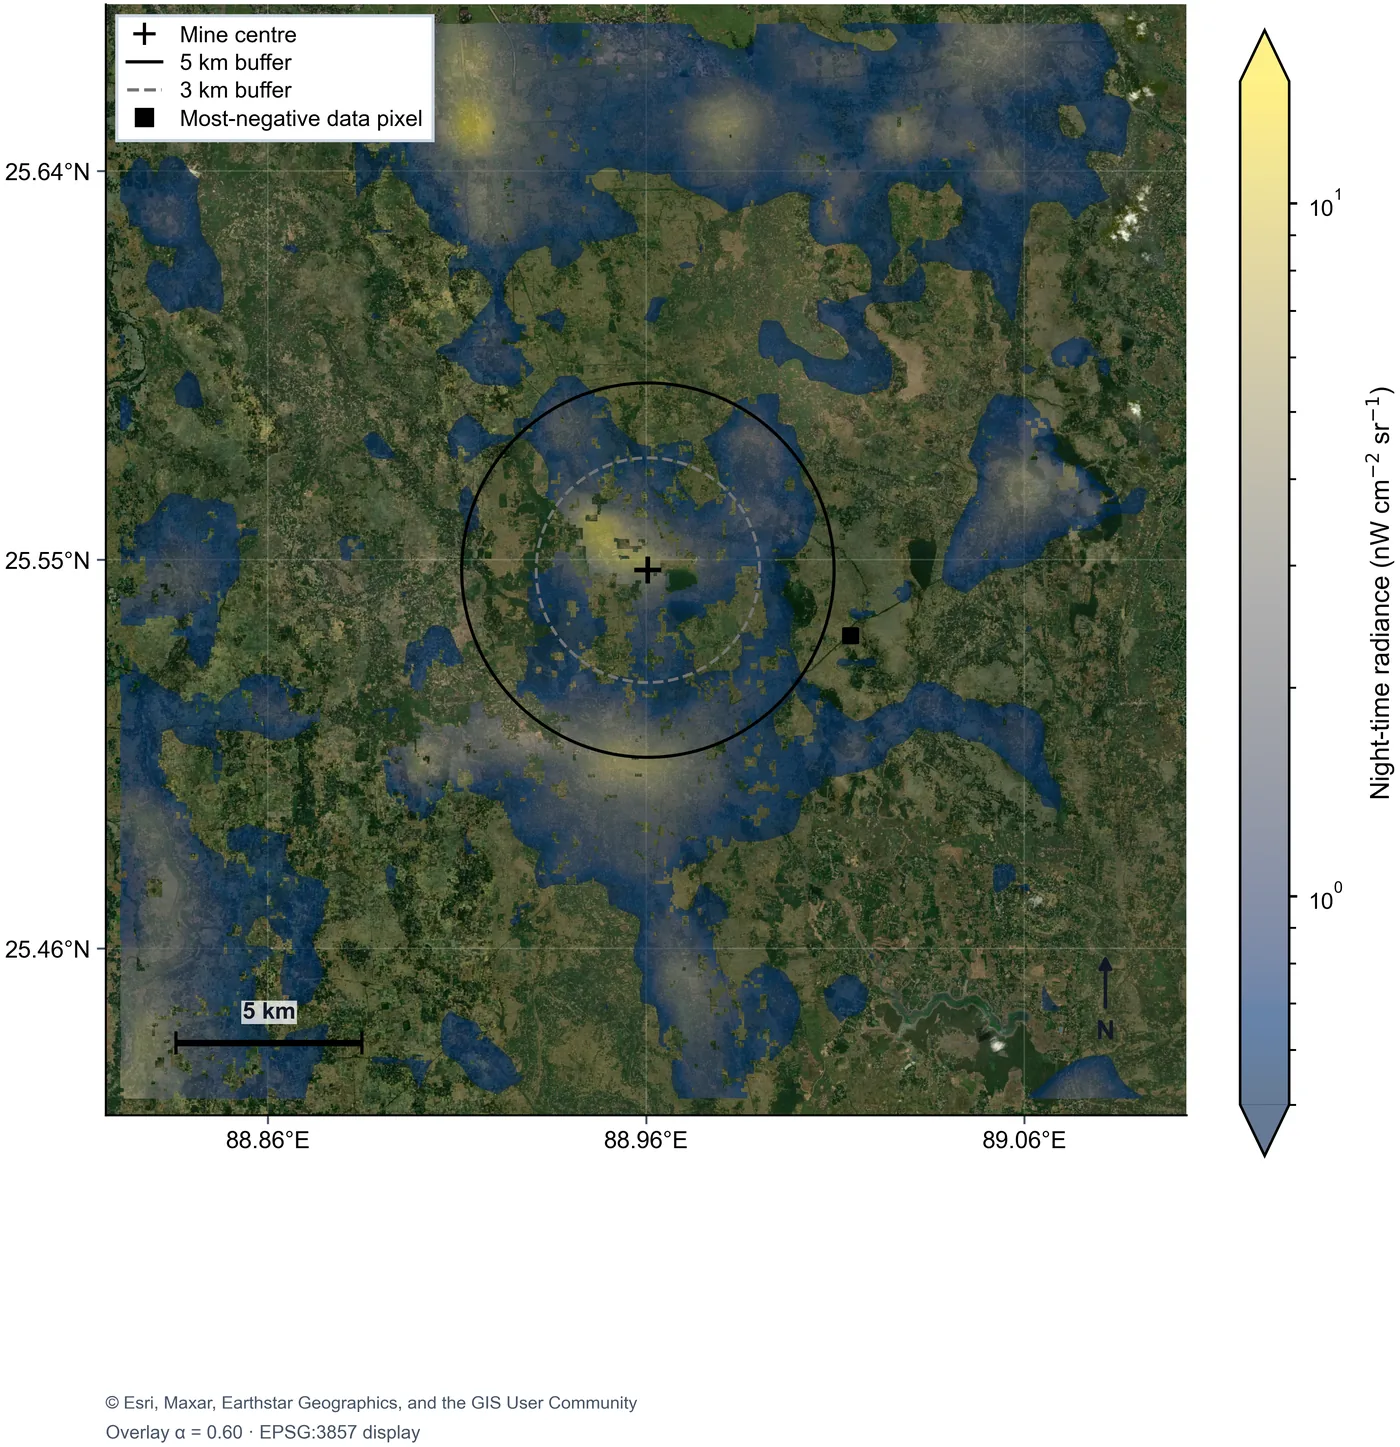
Night-time lights answer a different question — whether the plant is running. Pattern-level verification works with free data: the plant and the settlements beside it form one clear bright core, and the whole region brightened between 2020 and 2023, consistent with expanding electrification. Event-level verification does not: the open product is a monthly composite at about 500 m, so a two-week outage cannot be separated from ordinary monthly variation. That boundary is itself a finding — it specifies exactly what data a sharper answer would need.
夜间灯光回答的是另一个问题:电厂是否在运转。在“格局”层面,免费数据可以完成验证:电厂与周边聚落构成一个清晰的亮核,2020–2023 年整个地区都在变亮,与电气化扩展一致。在“事件”层面则不行:公开产品是约 500 米分辨率的月度合成,两周的停机无法与正常的月度波动区分开。这条边界本身就是一个发现——它精确地说明了想要更精细的答案需要什么样的数据。
For engineering safety the deformation record is the product itself. Hazards of this class are usually monitored with levelling lines and GNSS points, which are precise but sparse and tend to be funded only after something fails; the 2019 Brumadinho tailings disaster showed that freely available Sentinel-1 data had recorded precursory deformation that nobody was reading. An open pipeline can serve as that reading — as a forward screen that tells precision surveying where to go.
从工程安全的角度看,形变记录本身就是产品。这类风险通常用水准线路和 GNSS 点监测,精度高但点位稀疏,而且往往要等出了事才有经费;2019 年巴西 Brumadinho 尾矿坝溃坝事件表明,免费的 Sentinel-1 数据早已记录下溃坝前的形变征兆,只是没有人在看。开放的处理流程可以承担“看”的角色——作为一道前置筛查,告诉精密测量该去哪里。
Nothing in the method is specific to Barapukuria beyond its coordinates: it applies wherever Sentinel coverage exists and no ground record does, which describes much of South Asia and the developing world. It does not replace precision surveying; it tells precision surveying where to go.
除了坐标之外,这套方法没有任何地方专属于 Barapukuria:凡是有 Sentinel 覆盖、却没有地面记录的地方都适用,而这正是南亚和广大发展中地区的常态。它不能取代精密测量,但能告诉精密测量该去哪里。
Bosar:
An Install-and-Run SAR Interferometry Toolbox for Windows and macOS
Bosar:
Windows 与 macOS 均可直接安装运行的合成孔径雷达干涉测量工具箱
Radar interferometry measures ground motion to the millimetre and sees through cloud and darkness, which makes it the natural instrument for places no one can visit: a city at war, a subsiding mine, an aquifer under strain. The open-source tools that do this well are powerful, but most run as Linux command-line chains (ISCE, MintPy, GMTSAR), and the desktop option, ESA SNAP, stops short of time-series analysis, which then needs a second, command-line toolchain. I started Bosar for a narrower purpose — conflict-damage monitoring with Sentinel-1 coherence change detection, packaged so that an analyst can install it and run it — and it grew into a general InSAR toolbox.
雷达干涉测量能以毫米级精度测量地表形变,并且不受云层和黑夜影响,因此天然适合观察那些无法实地到访的地方:交战中的城市、正在沉降的矿区、超采的含水层。现有的开源工具功能强大,但大多以 Linux 命令行处理链的形式运行(ISCE、MintPy、GMTSAR);有桌面界面的 ESA SNAP 又不覆盖时间序列分析,做时序时还得再接一套命令行工具。我开发 Bosar 的初衷更具体:用 Sentinel-1 相干变化检测做冲突损毁监测,并把它做成分析人员装上就能用的软件。后来它逐步扩展为一个通用的 InSAR 工具箱。
Bosar packages the chain from data search to time series — Sentinel-1 download, orbits and DEM, coregistration, interferometry, unwrapping, atmospheric correction, and SBAS and PS/DS time series — into one source tree and one application for Windows and macOS, using an NVIDIA GPU when one is present. Every action in the window is one bosar command shown on screen, and every run writes a UTC-stamped log, so any result can be audited and reproduced step by step.
Bosar 把从数据检索到时间序列的整条处理链——Sentinel-1 下载、轨道与 DEM、配准、干涉、相位解缠、大气校正,以及 SBAS 与 PS/DS 时间序列——放进同一套代码和同一个 Windows / macOS 应用里,有 NVIDIA 显卡时自动启用 GPU。界面上的每个操作都对应一条显示在屏幕上的 bosar 命令,每次运行都写入带 UTC 时间戳的日志,因此任何结果都可以逐步审计、逐步复现。
At a Glance
概览
- Methods built: two-pass DInSAR; coherence change detection with damage-proxy maps; amplitude change; SBAS with network design, closure checks and GACOS/ERA5 tropospheric correction; PS/DS phase linking and classic PSI; native Sentinel-1 TOPS coregistration without SNAP, with sub-swath merge, radiometric calibration and split-spectrum ionospheric correction (development version).
- Validation: SBAS velocities within 0.4 mm/yr of MintPy on identical inputs; native coregistration and calibration checked against ESA SNAP on the same scenes.
- Scale: about 52,000 lines of Python in 199 modules, with more than 600 automated tests.
- Licence: AGPL-3.0, with commercial licences available from the author; code adapted only from permissive sources and recorded file by file; GPL projects (MintPy, SNAP) used as documentation only, enforced by an automated test.
- Status: pre-alpha. v0.2.0-alpha was completed on 30 September 2026; three further development rounds closed on 5 October 2026. The repository stays private while the first public release is prepared.
- 已实现的方法:两轨差分干涉(DInSAR);相干变化检测与损毁代理图;振幅变化;SBAS(网络设计、闭合检验、GACOS/ERA5 对流层校正);PS/DS 相位联结与经典 PSI;不依赖 SNAP 的 Sentinel-1 TOPS 原生配准,含子条带拼接、辐射定标与分频谱电离层校正(开发版)。
- 验证:在相同输入下,SBAS 速度与 MintPy 结果相差在 0.4 毫米/年以内;原生配准与辐射定标在同一批影像上与 ESA SNAP 做过比对。
- 规模:约 52,000 行 Python 代码、199 个模块,600 多个自动化测试。
- 许可证:AGPL-3.0,另可向作者申请商业授权;只从宽松许可证的项目改编代码,并逐个文件登记;GPL 项目(MintPy、SNAP)只作为文档参考,由自动化测试把关。
- 状态:预发布阶段。v0.2.0-alpha 于 2026年9月30日完成,此后又完成三轮开发(2026年10月5日结束)。正式公开发布前,代码仓库暂不公开。
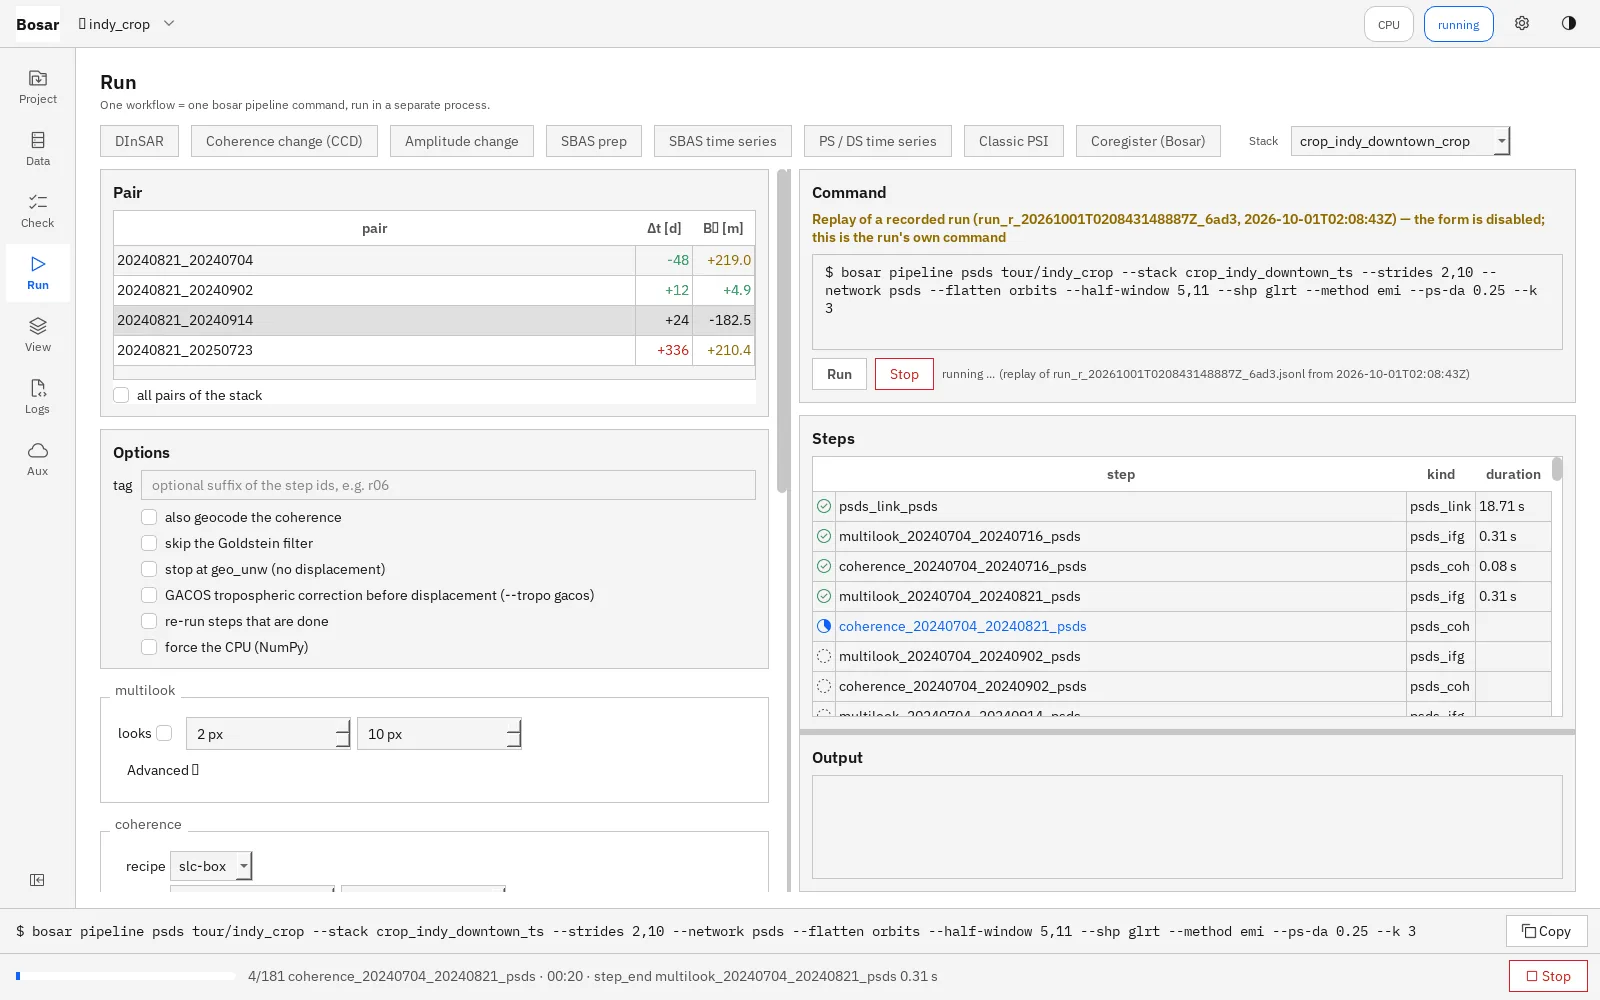
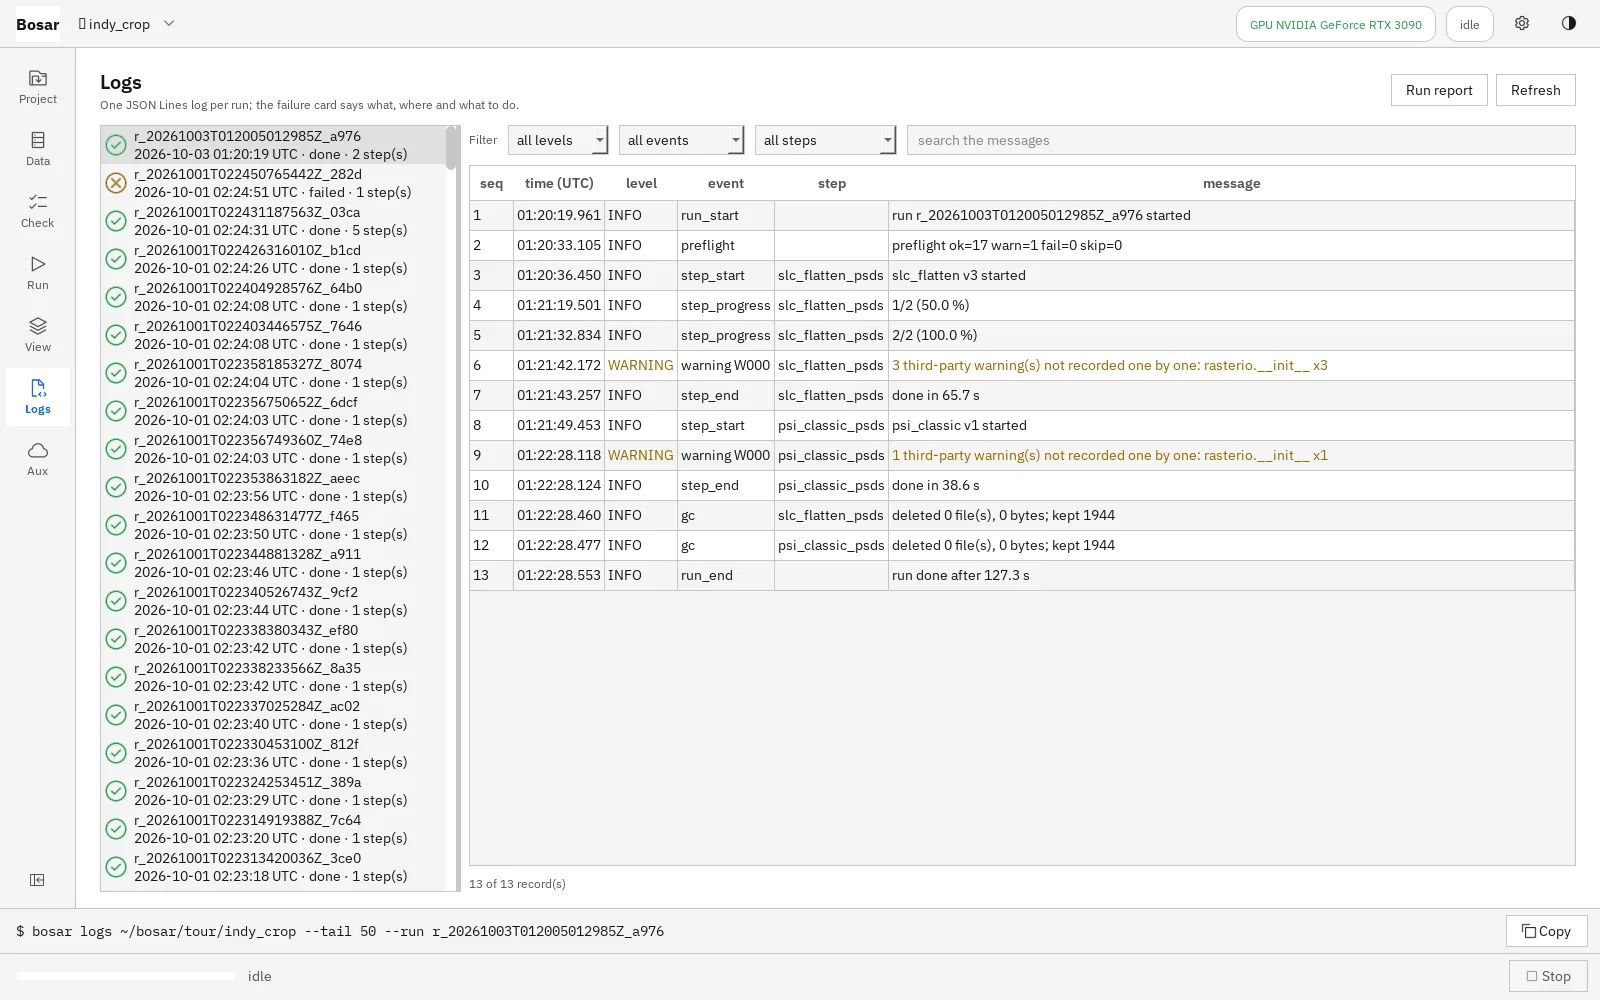
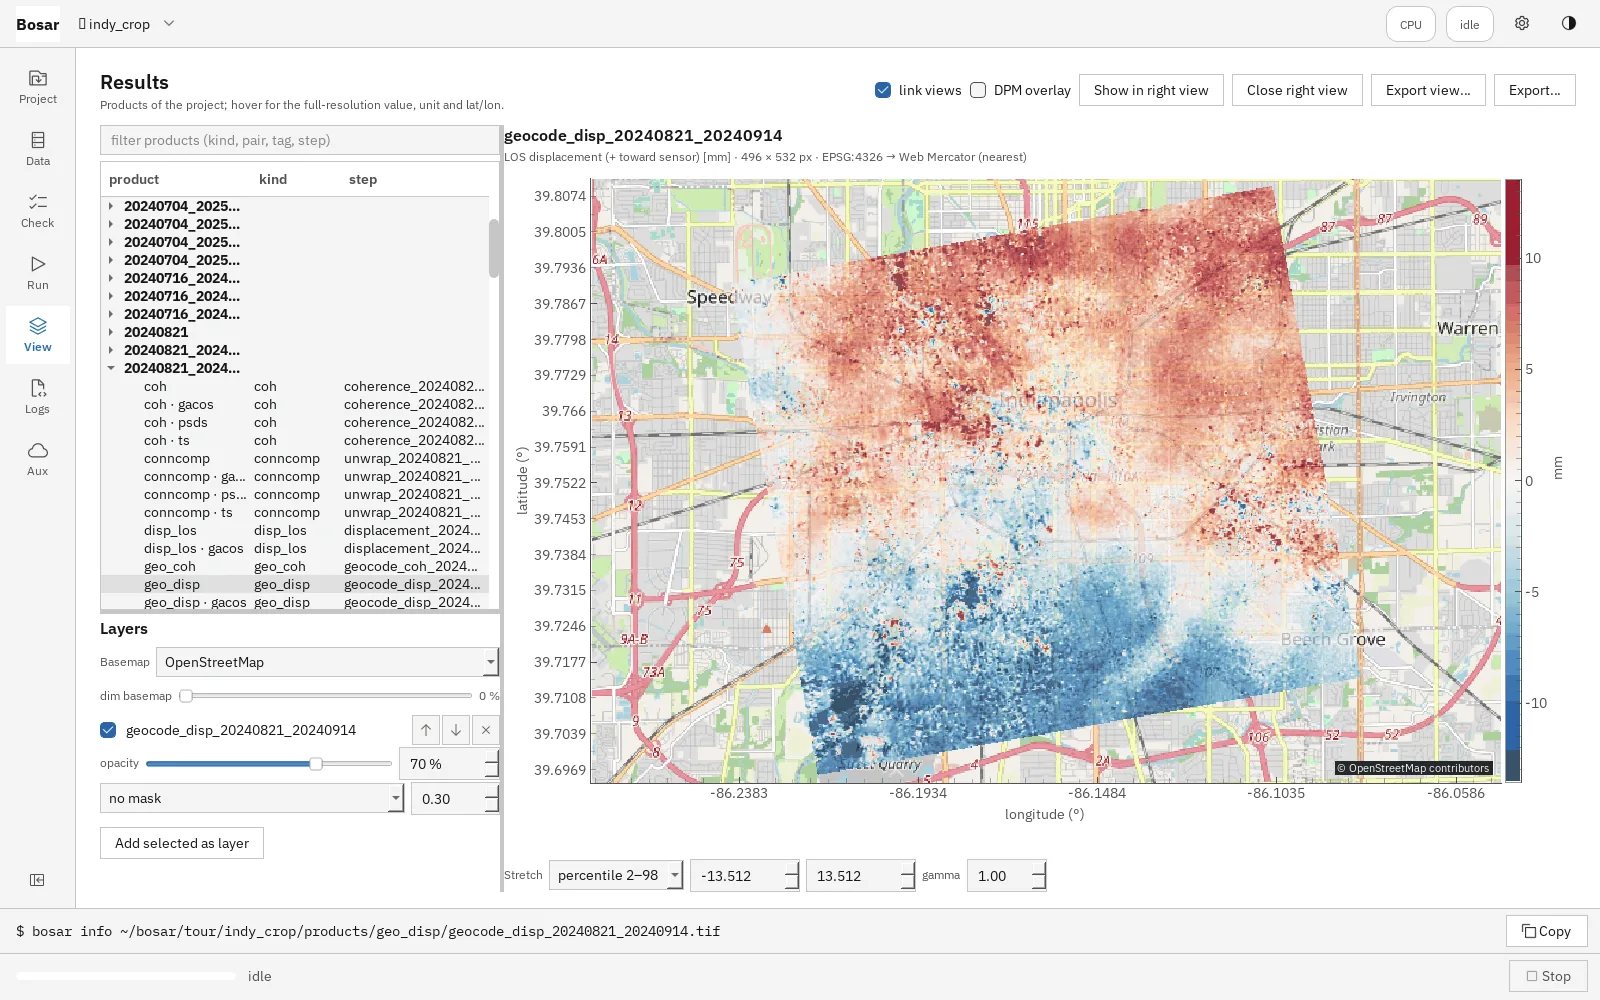
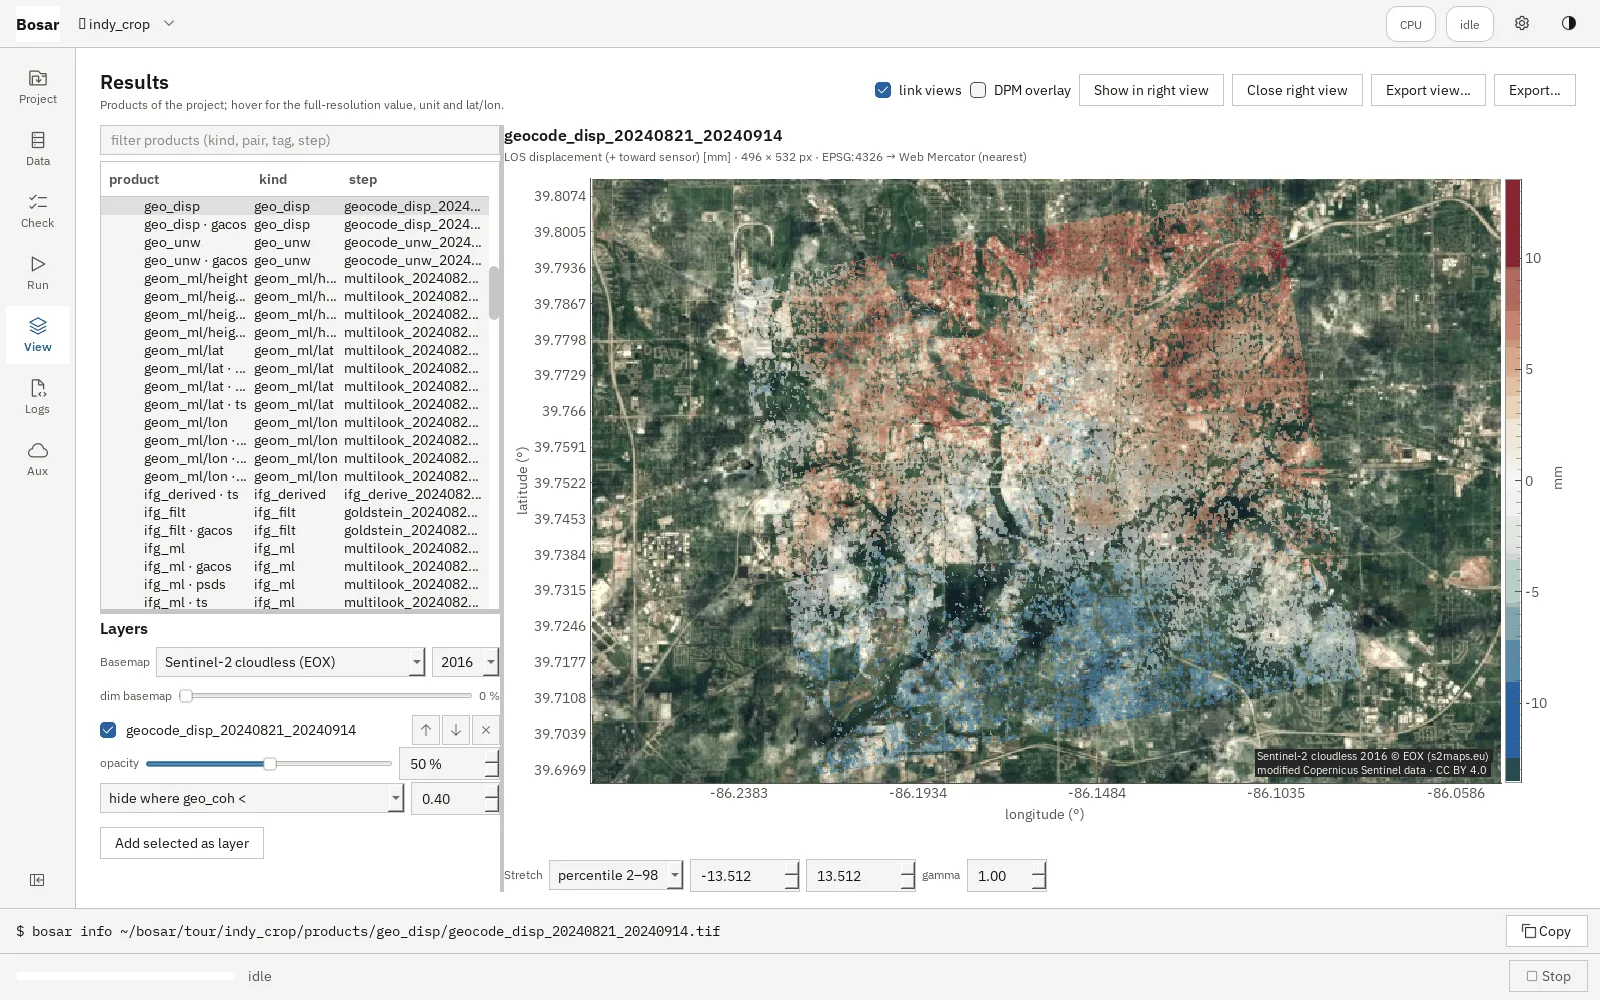
The workflow I built Bosar for is coherence change detection. A radar pixel that keeps its phase from one acquisition to the next is stable; one that loses it has changed. Comparing the coherence of pairs spanning an event against the spread of pre-event pairs gives a damage-proxy map — the coherence method that my Khartoum assessment identifies as the next step beyond intensity differencing.
我开发 Bosar 时首先瞄准的是相干变化检测。一个雷达像元若在前后两次成像之间保持相位一致,说明它没有变化;失去相干,说明它变了。把跨越事件的影像对的相干性,与事件之前各影像对的离散程度相比较,就得到损毁代理图。我在喀土穆冲突评估中指出,这类相干方法正是超越强度差分之后的下一步。
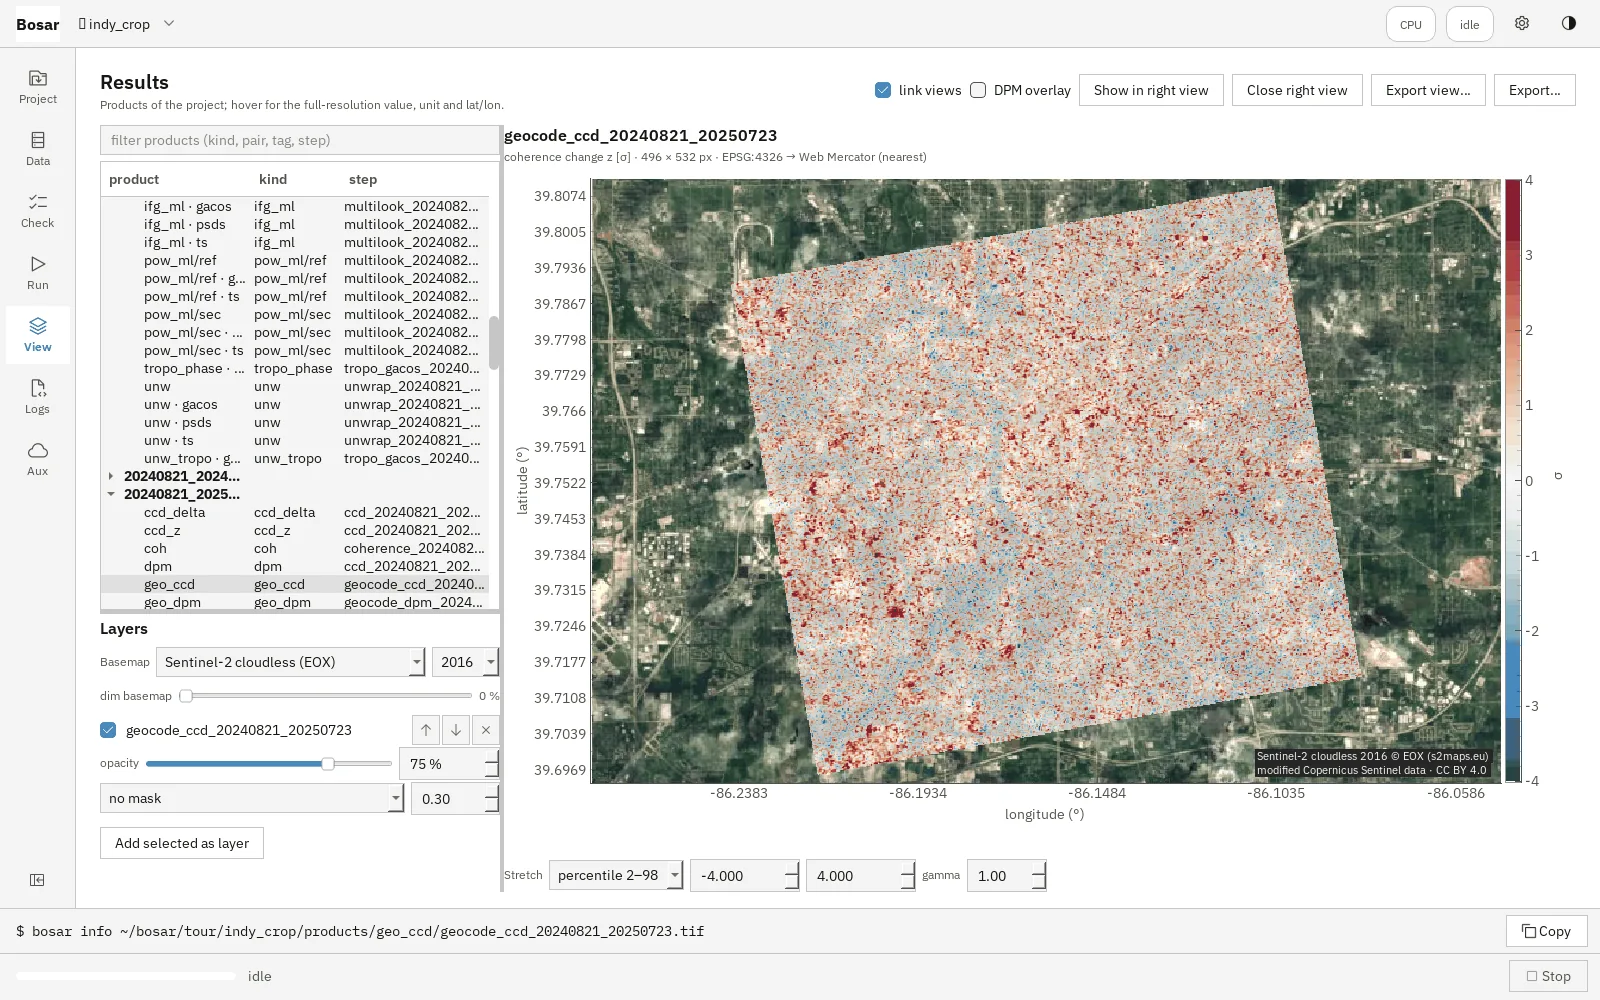
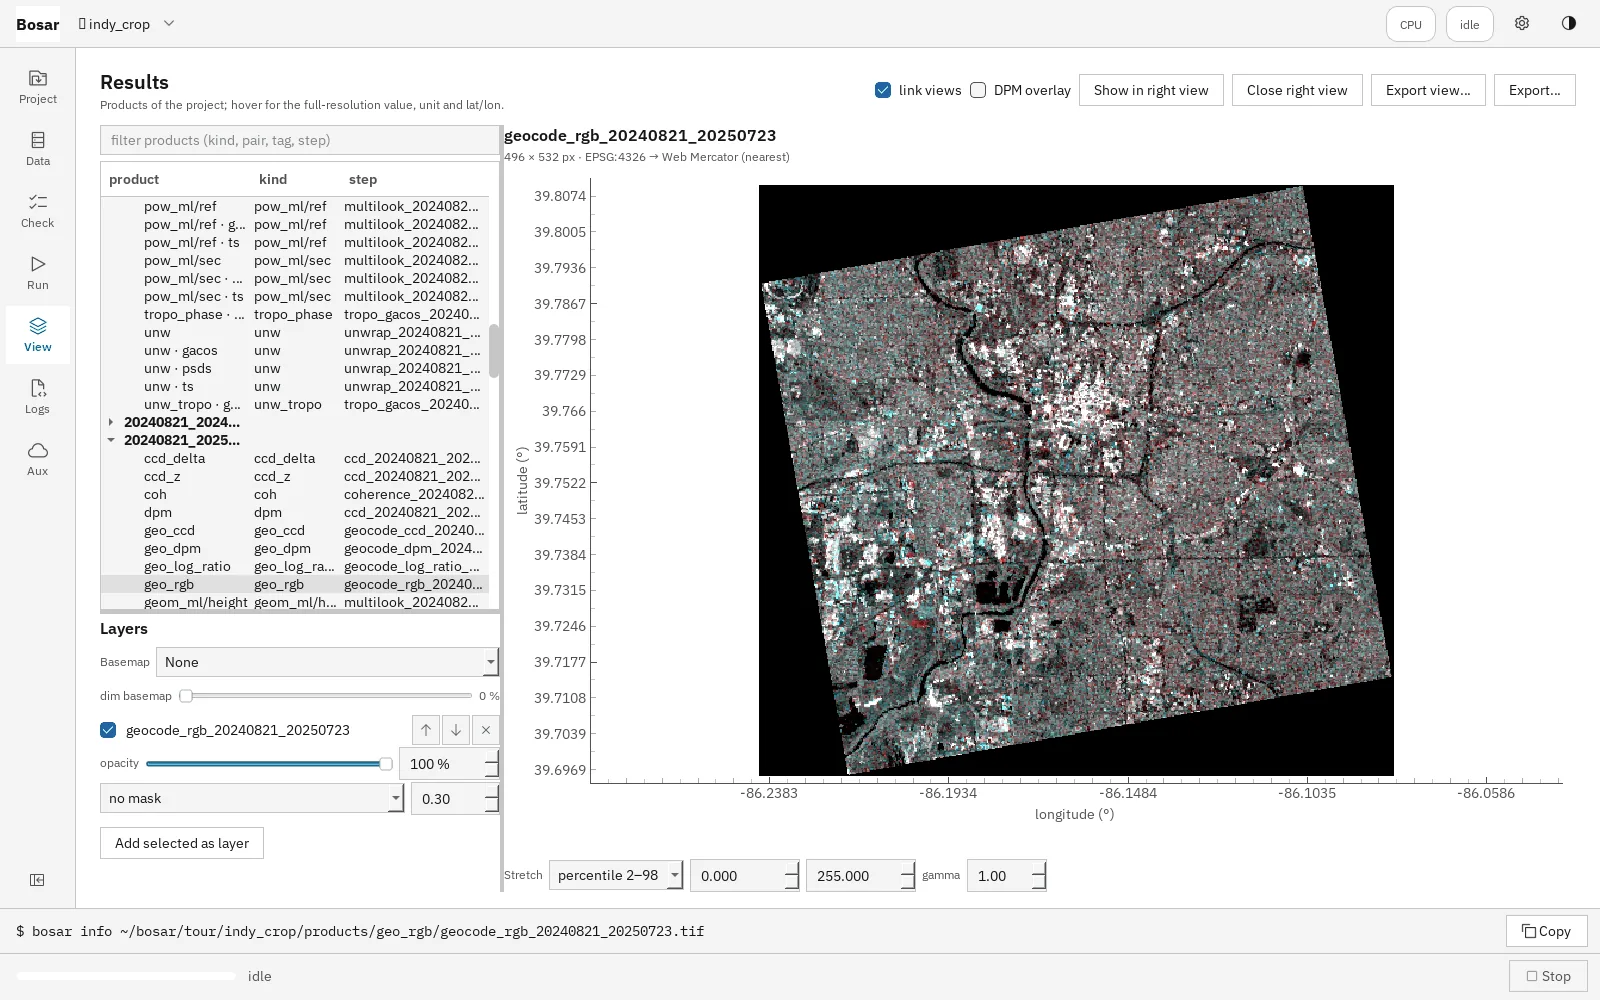
For slow motion — subsidence, settling infrastructure — Bosar builds time series. The network of interferometric pairs is designed from temporal and perpendicular baseline limits; triplet closure flags unwrapping errors before inversion; and the result arrives with a quality verdict that compares the measured spread of velocities with what the number of dates and the time span would lead one to expect.
对于缓慢的形变——地面沉降、基础设施沉降——Bosar 构建时间序列。干涉对网络依据时间基线和垂直基线的限制来设计;反演之前用三元组闭合检验找出解缠错误;结果附带一个质量判定,把实测的速度离散程度与“按影像数量和时间跨度应有的离散程度”相比较。
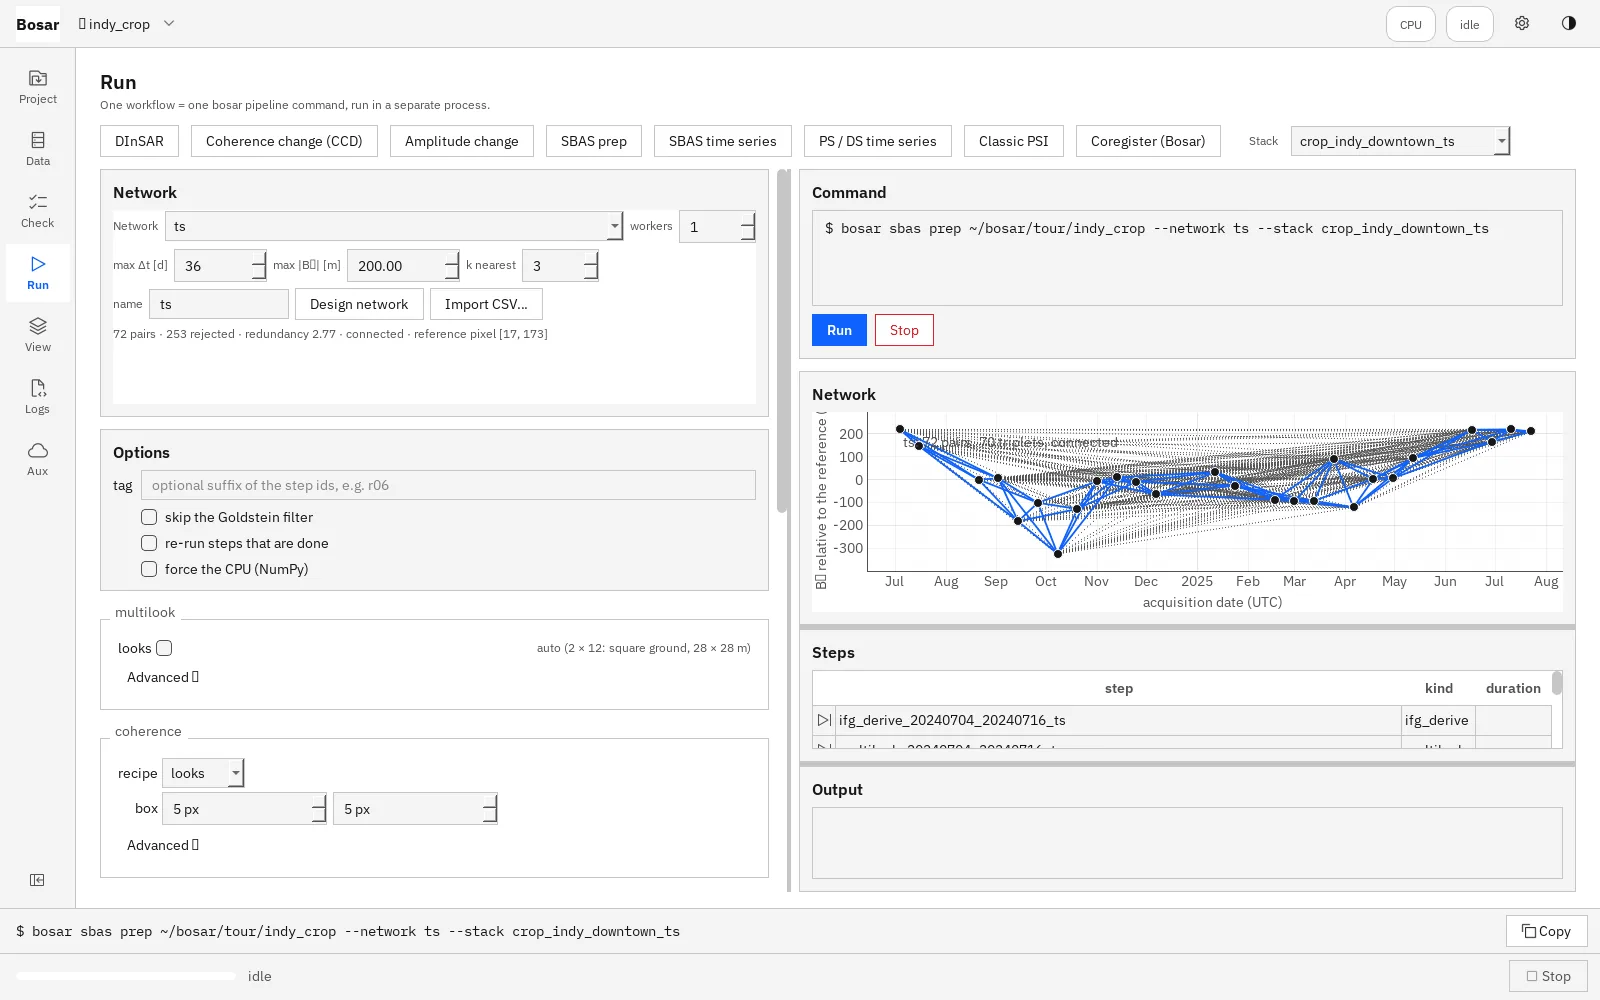
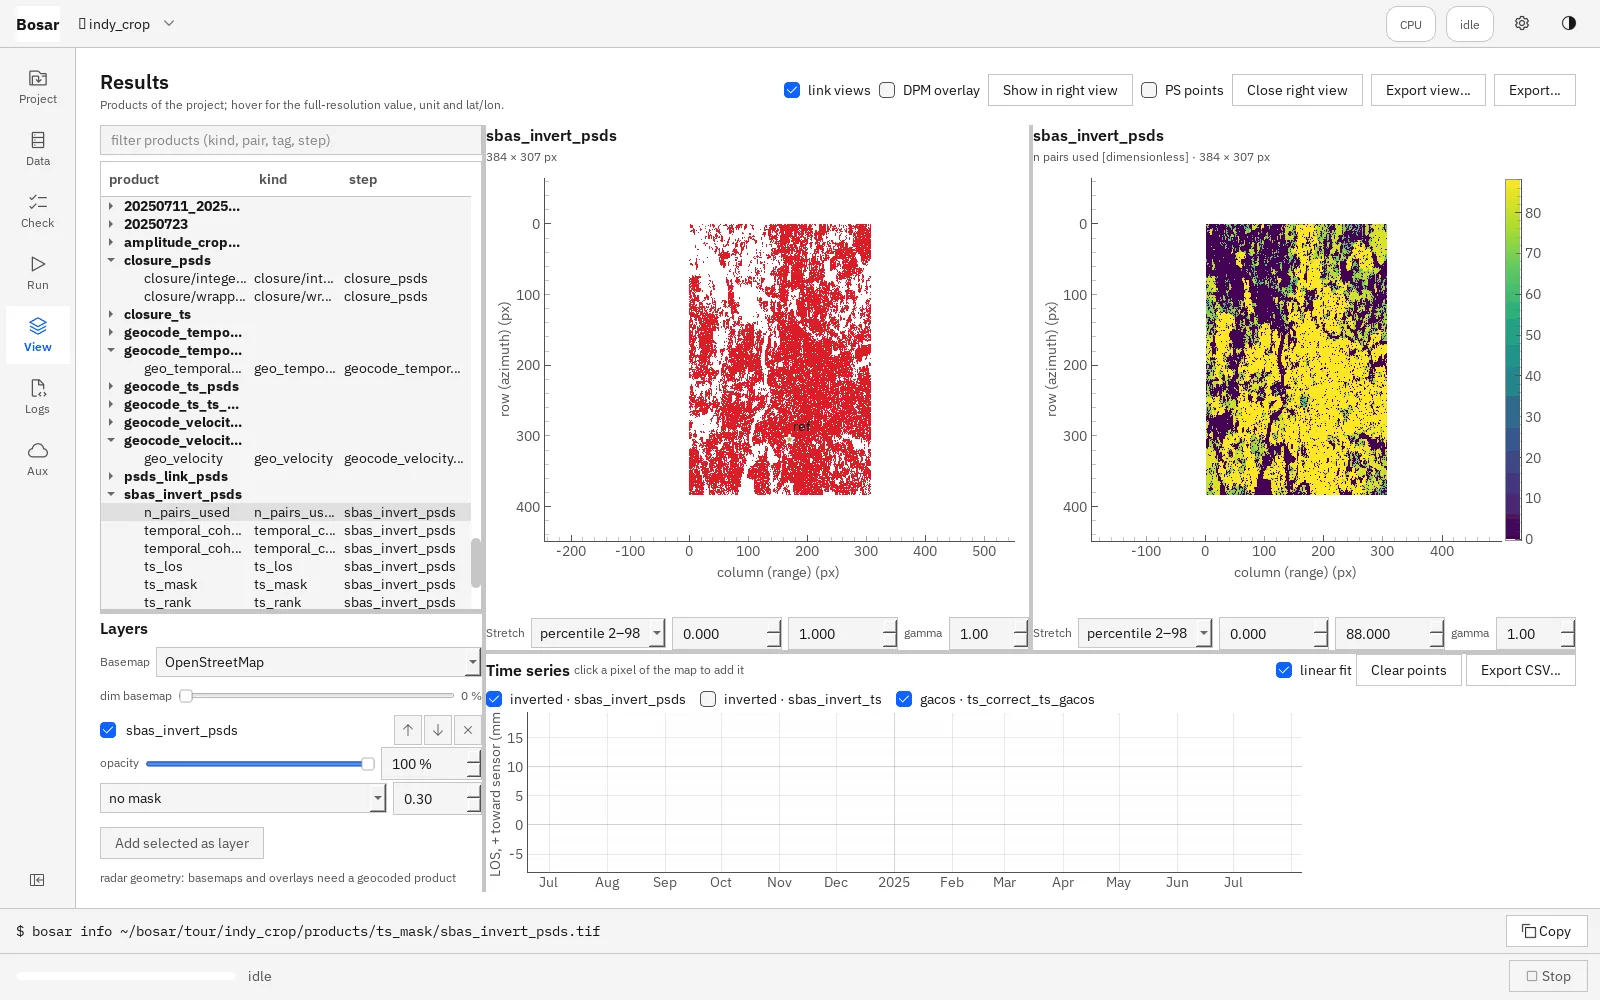
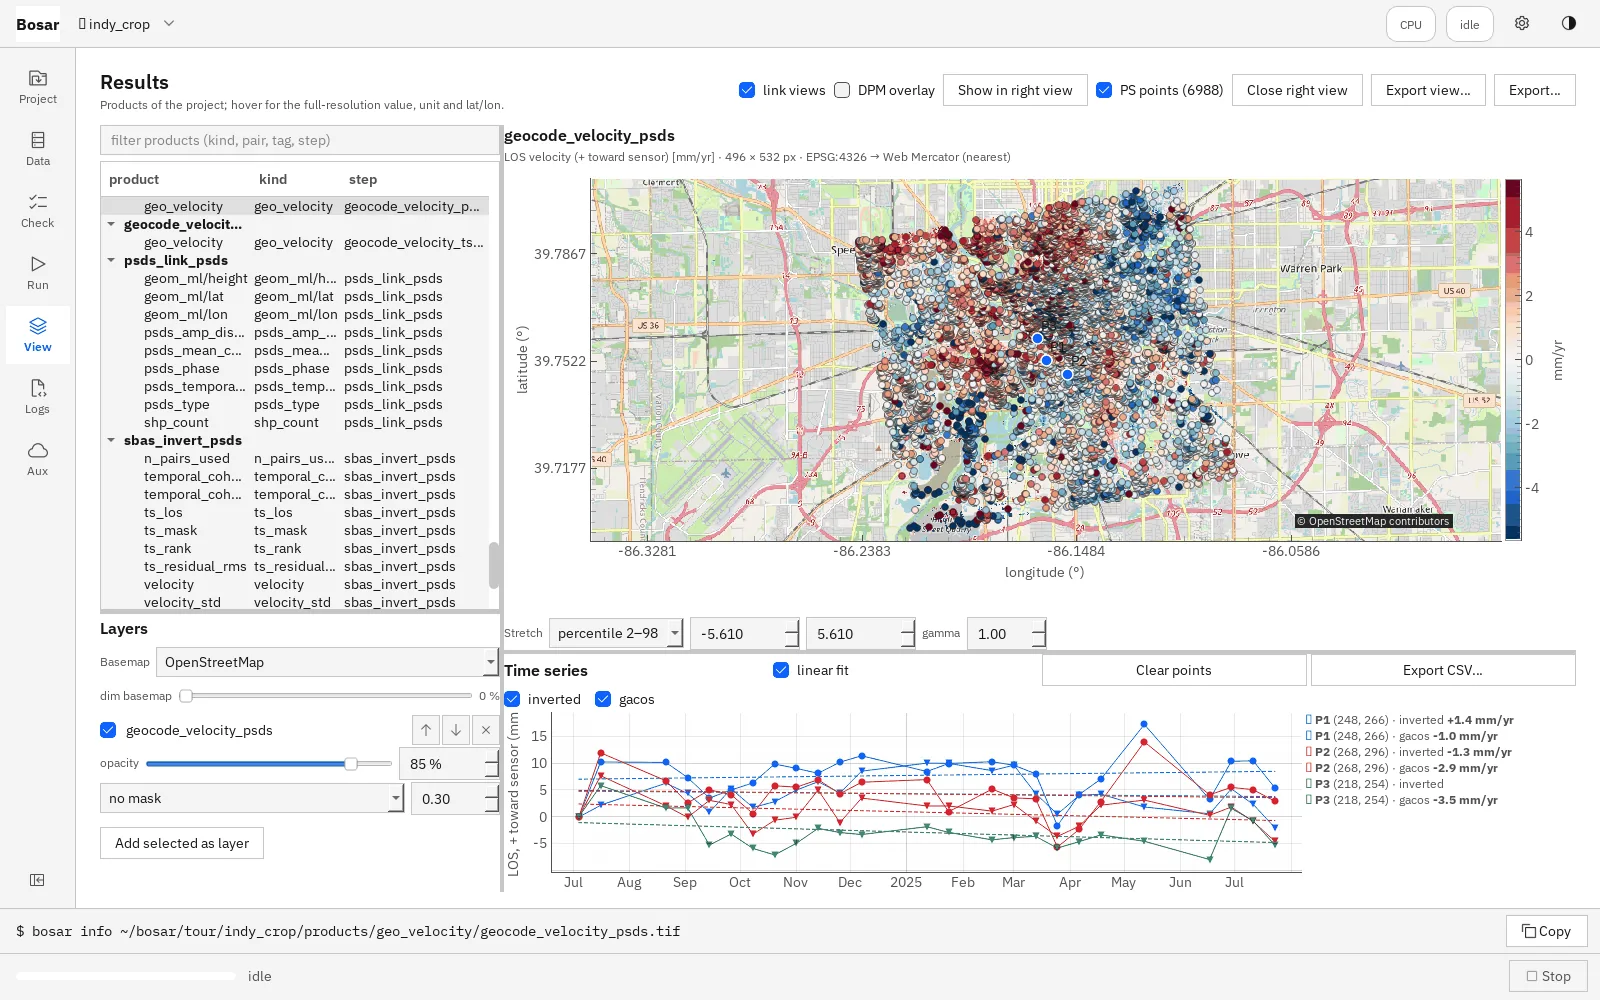
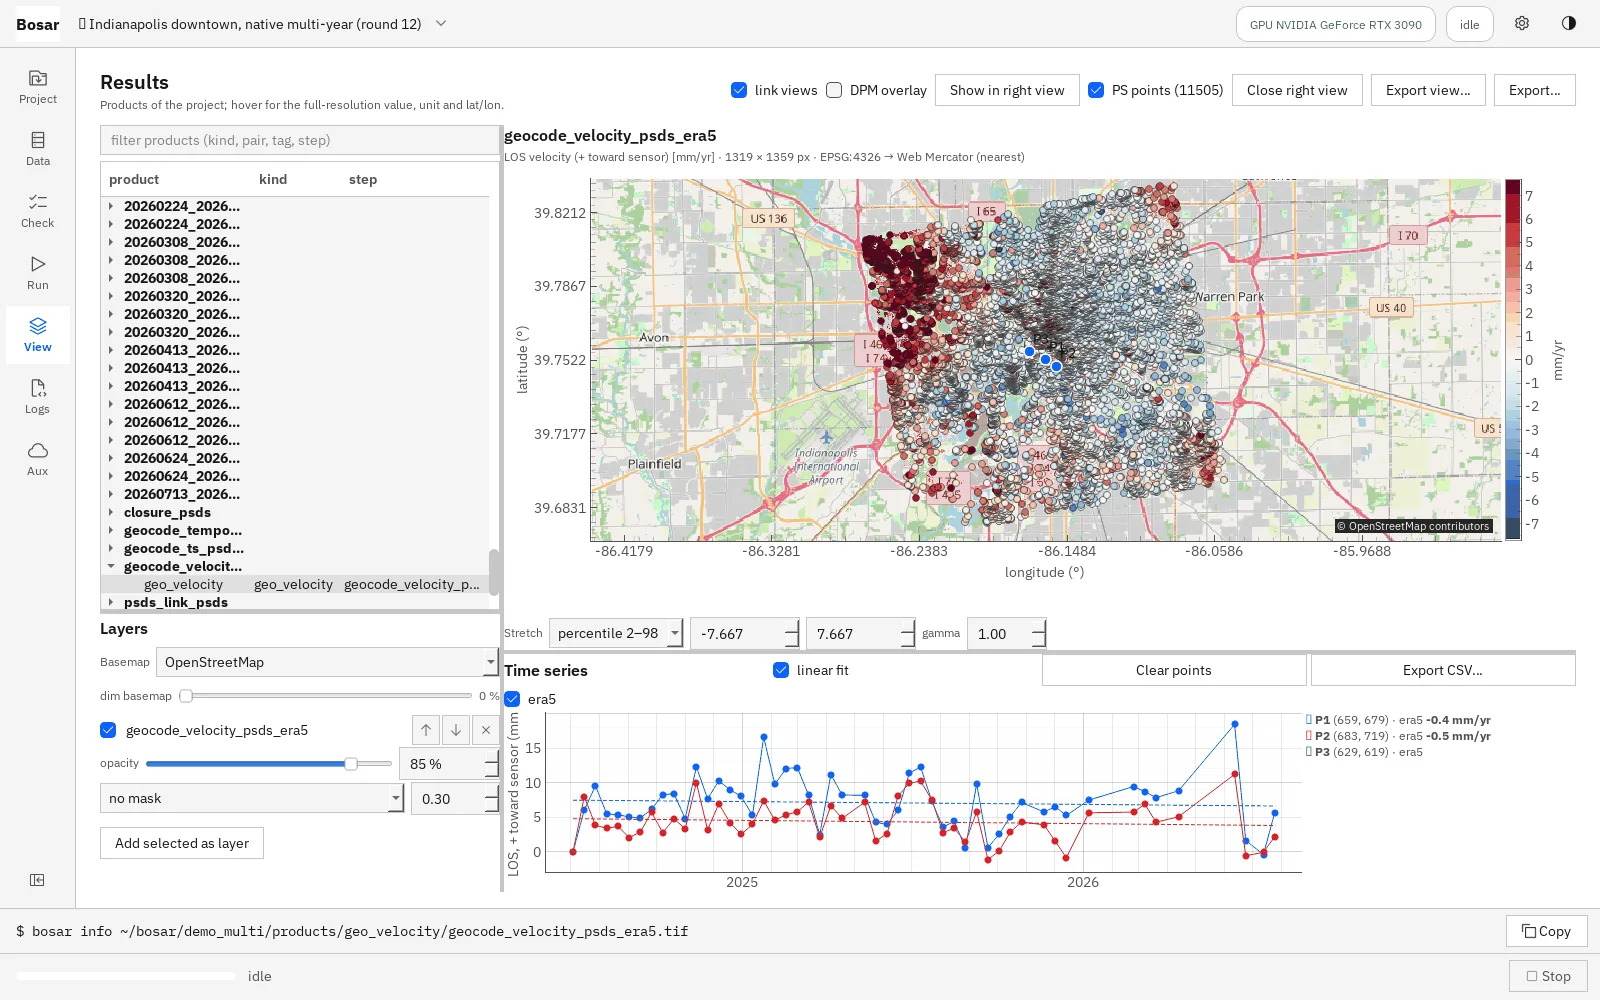
How it was built. I wrote the specification, the architecture and the validation plan, and I reviewed and accepted every development round. The implementation was carried out in twelve rounds with AI coding assistants working to that specification, each round closing with tests and a written record of the decisions taken. The engineering choices that matter most here — sign conventions written once and tested, kernels that run unchanged on CPU or GPU, products that carry their units and provenance — are the same ones that make my Khartoum and Barapukuria analyses auditable.
开发方式。我负责撰写需求说明、架构设计和验证方案,并审阅、验收每一轮开发。具体实现分十二轮进行,由 AI 编程助手按照这份说明完成,每一轮都以测试和书面决策记录收尾。这里最关键的工程选择——符号约定只写一次并有测试守护、同一套计算模块在 CPU 和 GPU 上不加修改地运行、每个产品都带着单位和来源信息——也正是让我的喀土穆与 Barapukuria 分析经得起审计的那些做法。
The repository is private during pre-alpha. I am glad to give a live demonstration or share the full feature tour on request.
预发布阶段代码仓库暂不公开。如有兴趣,欢迎联系我进行现场演示,或索取完整的功能导览。
Gallery
摄影
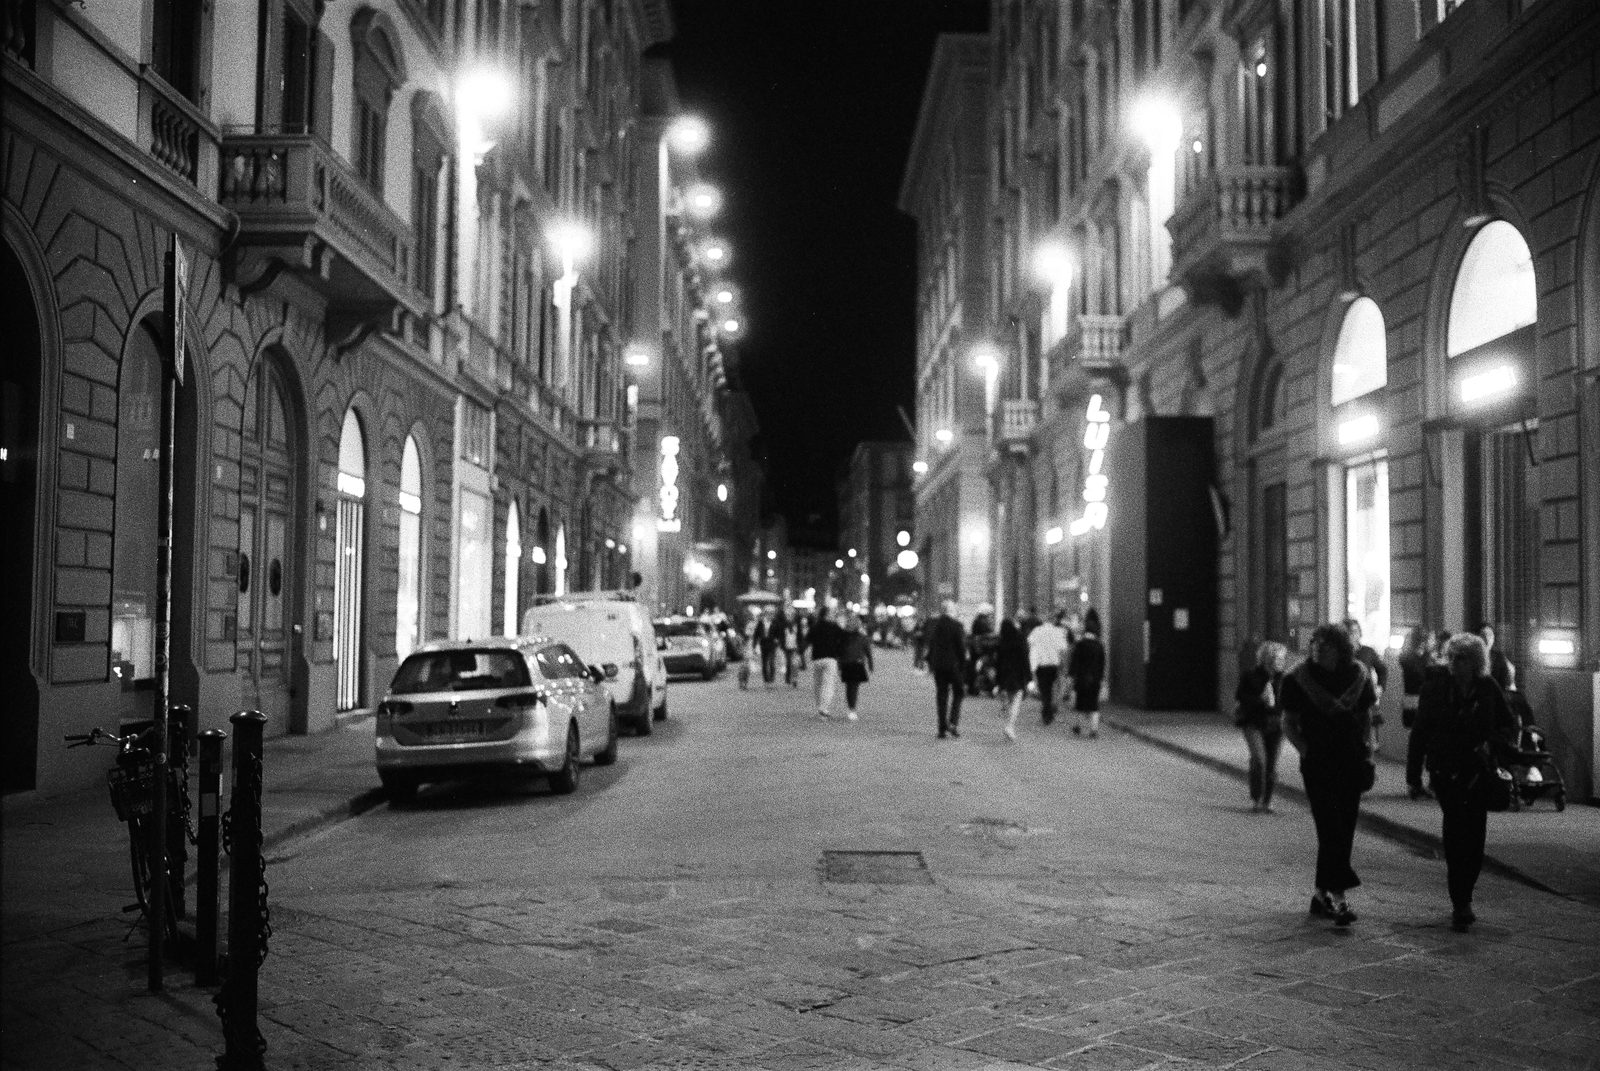
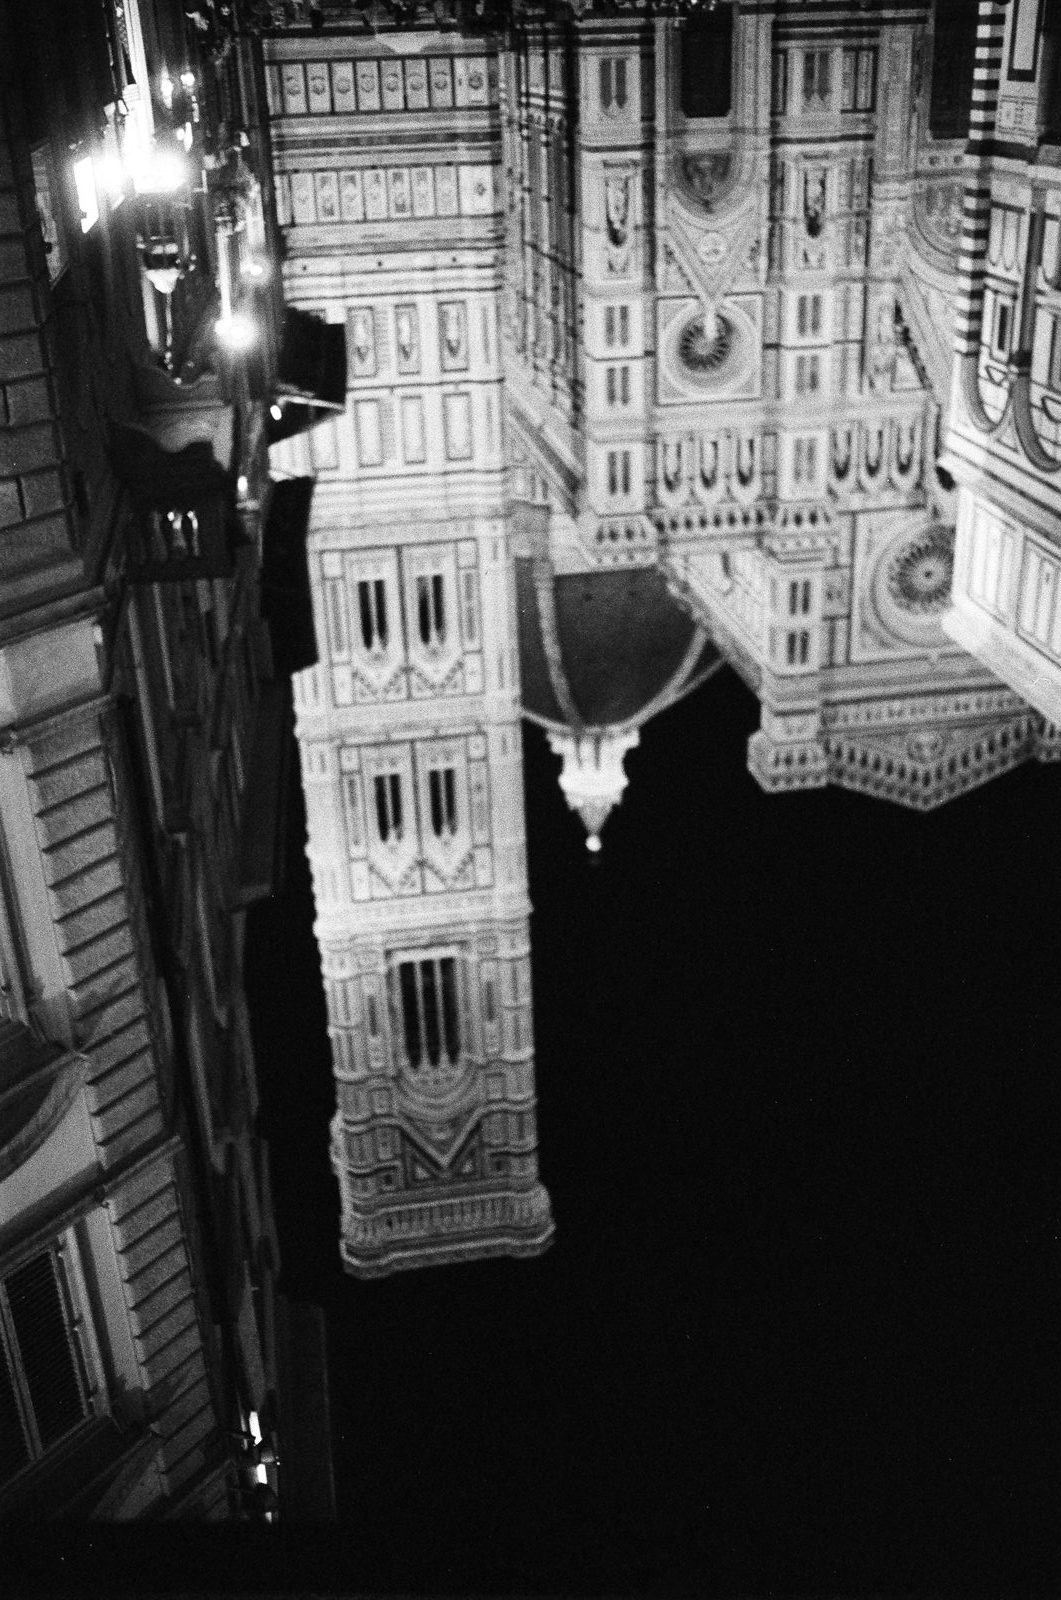
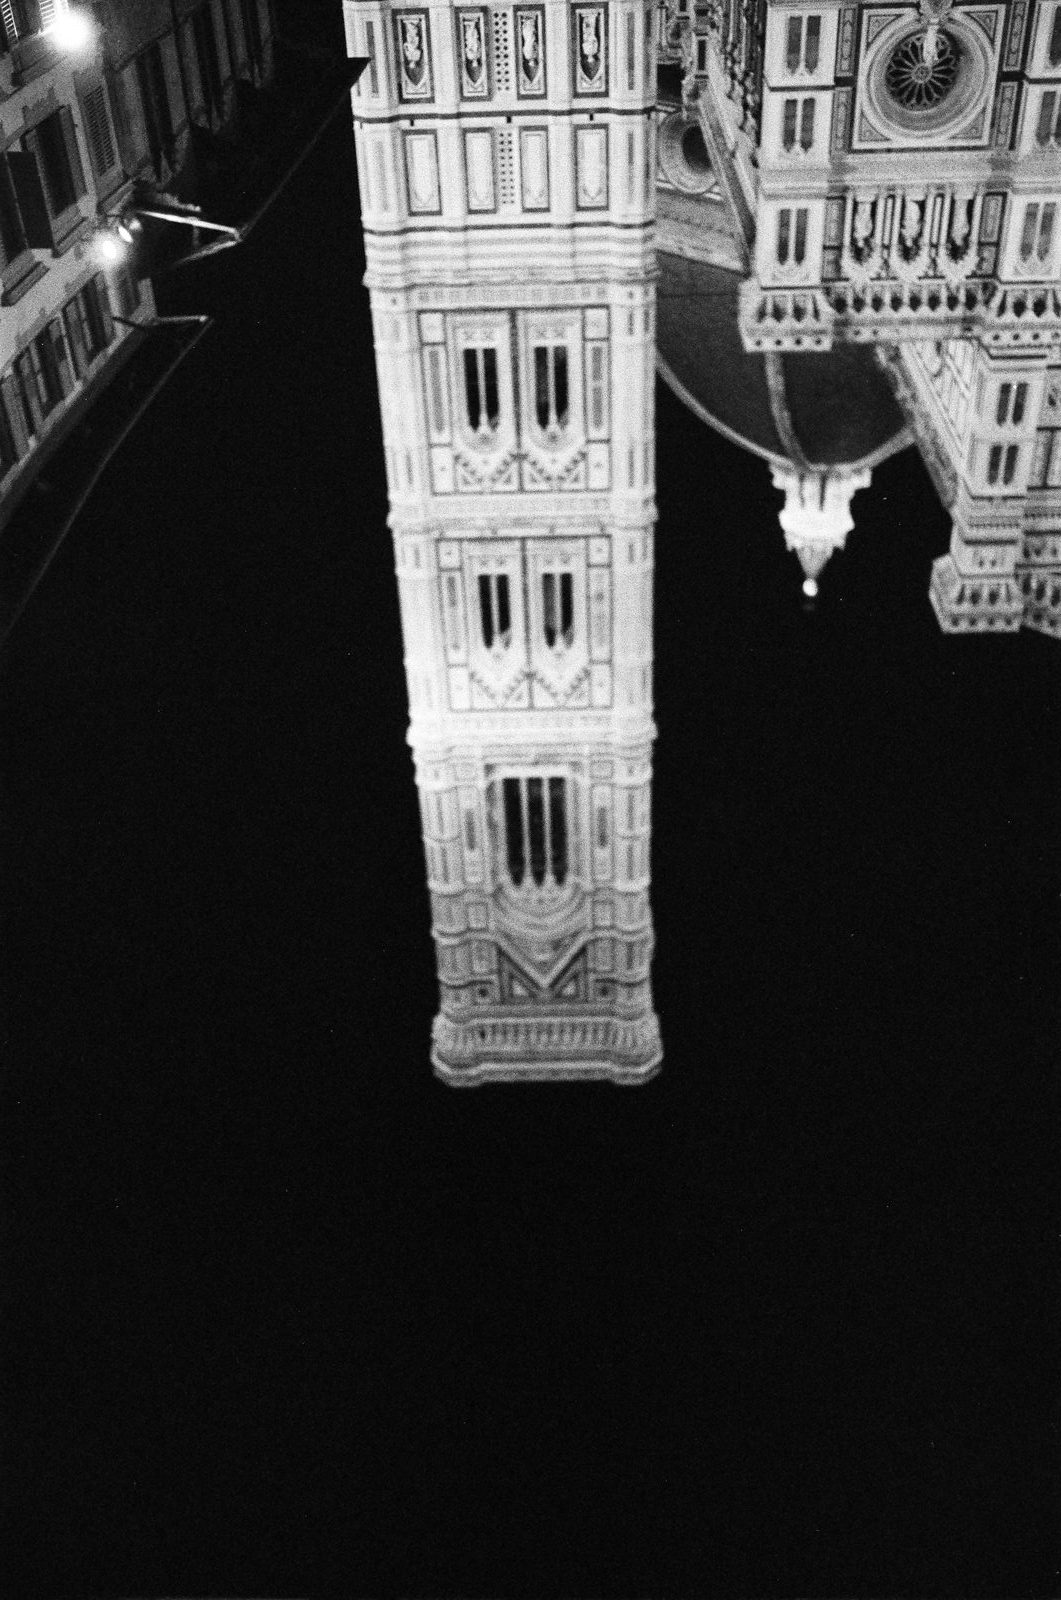
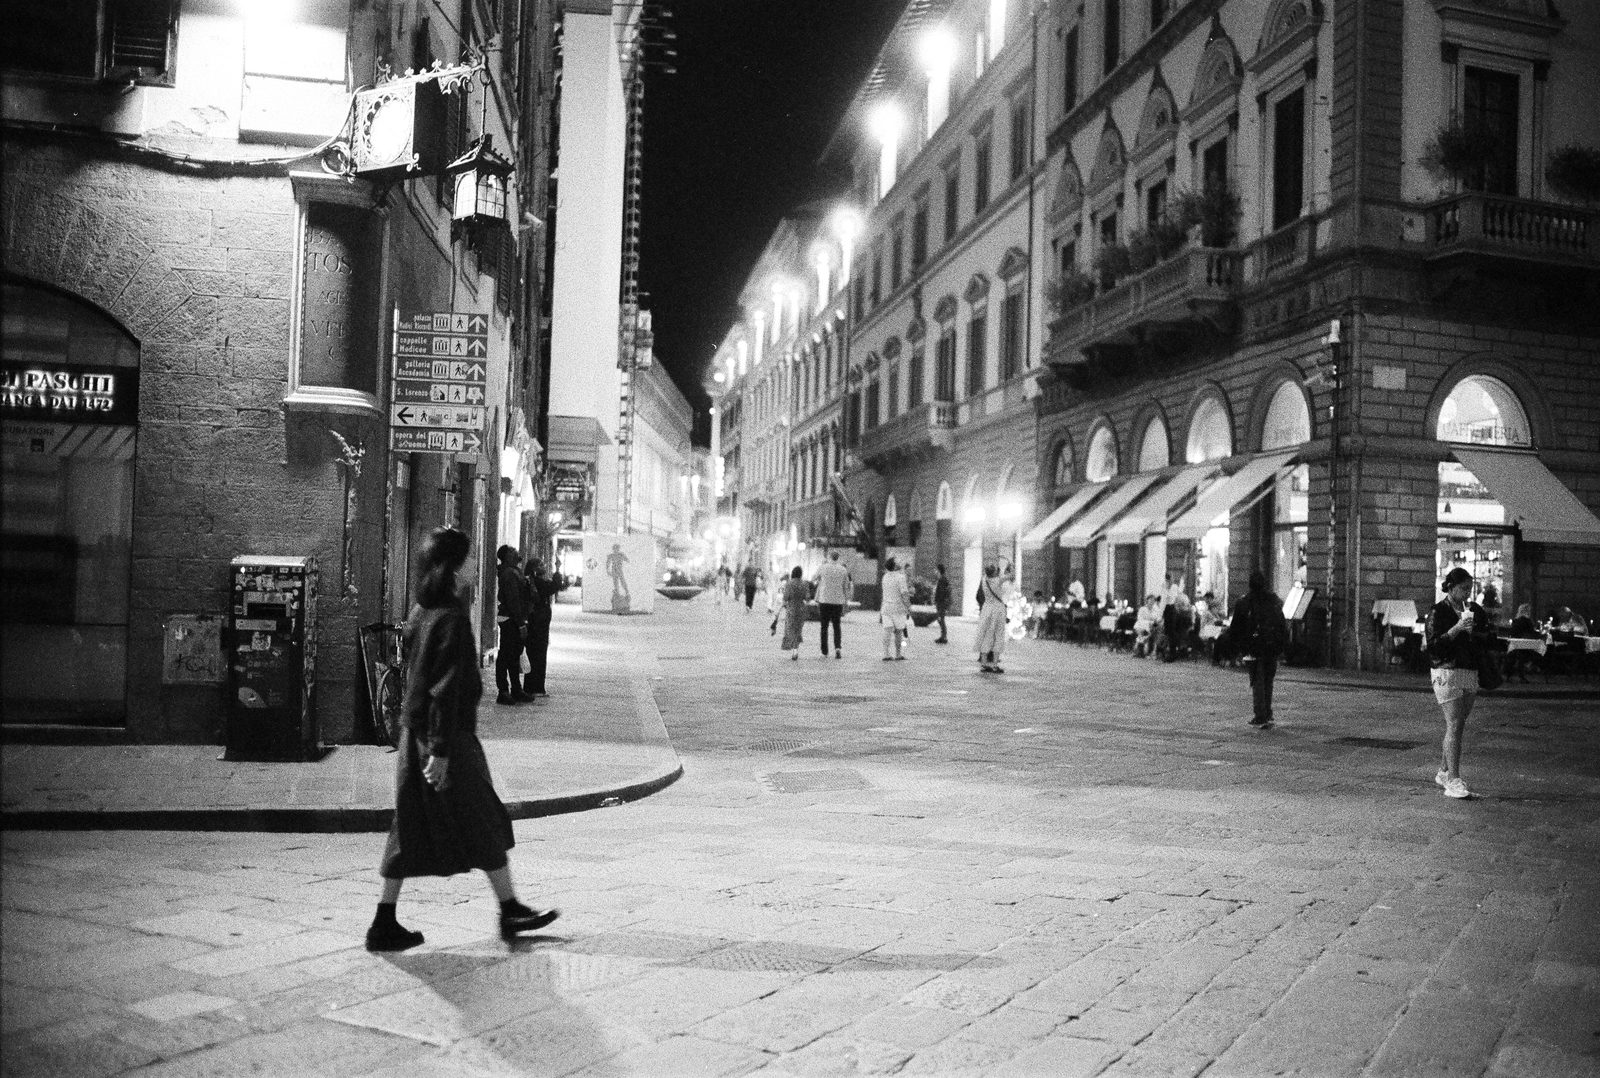
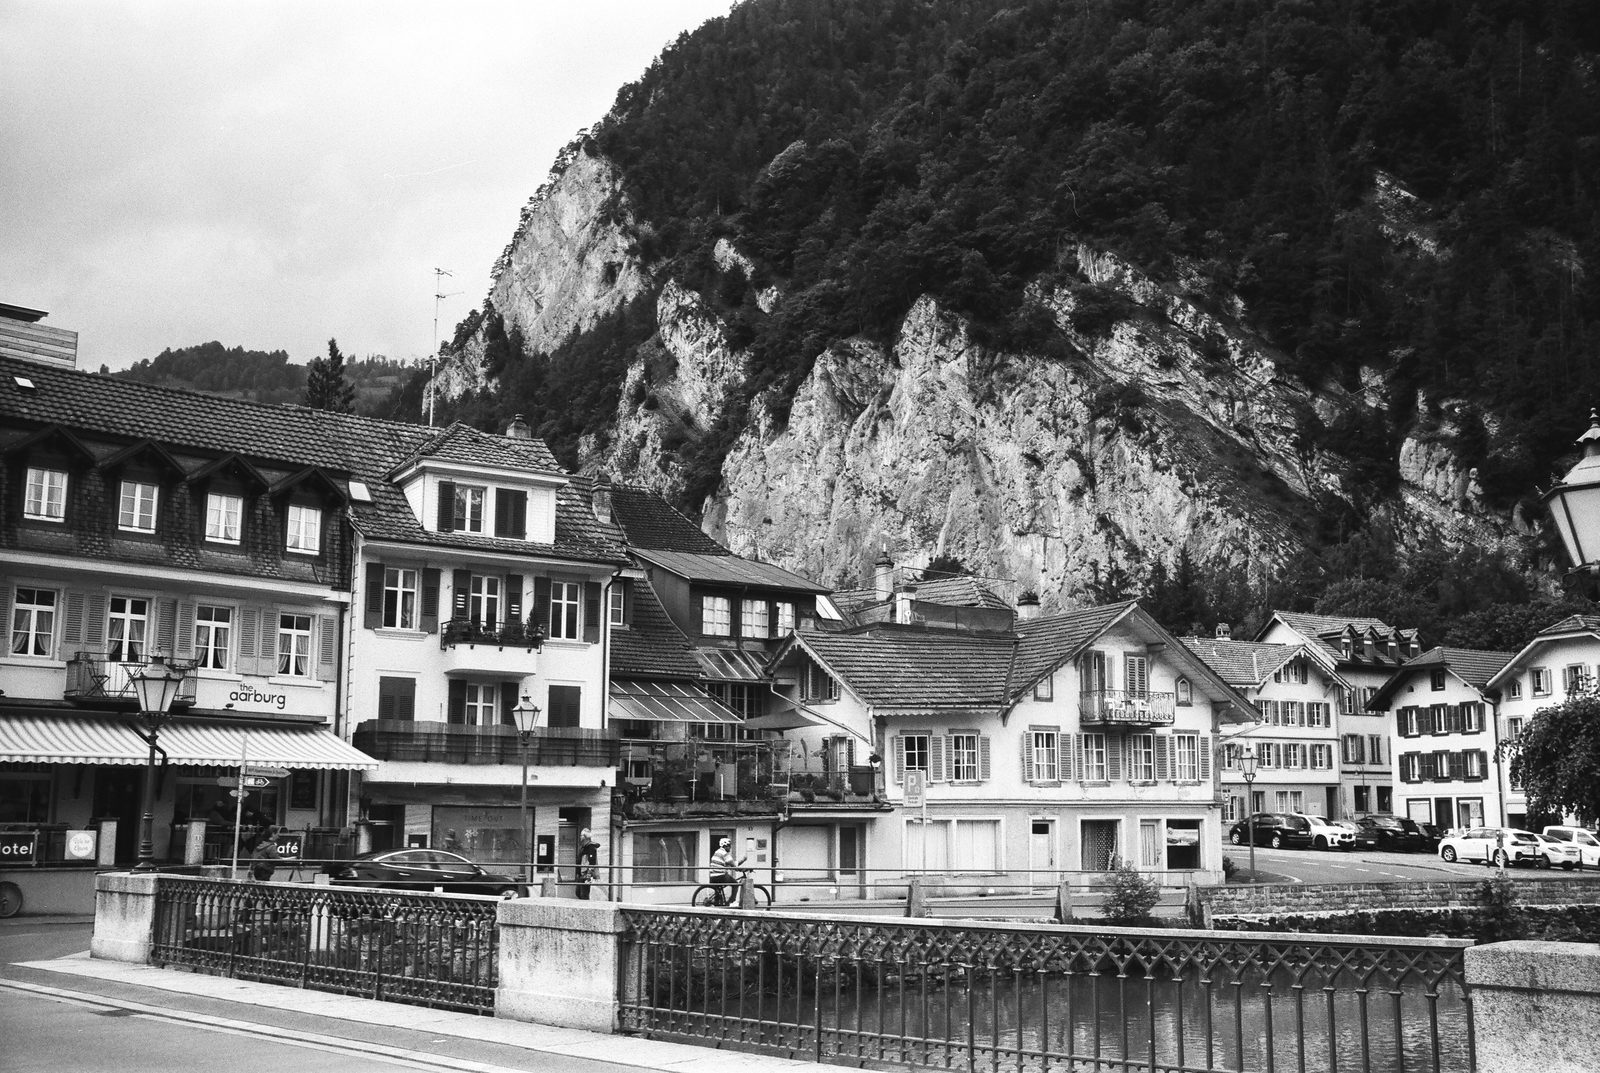
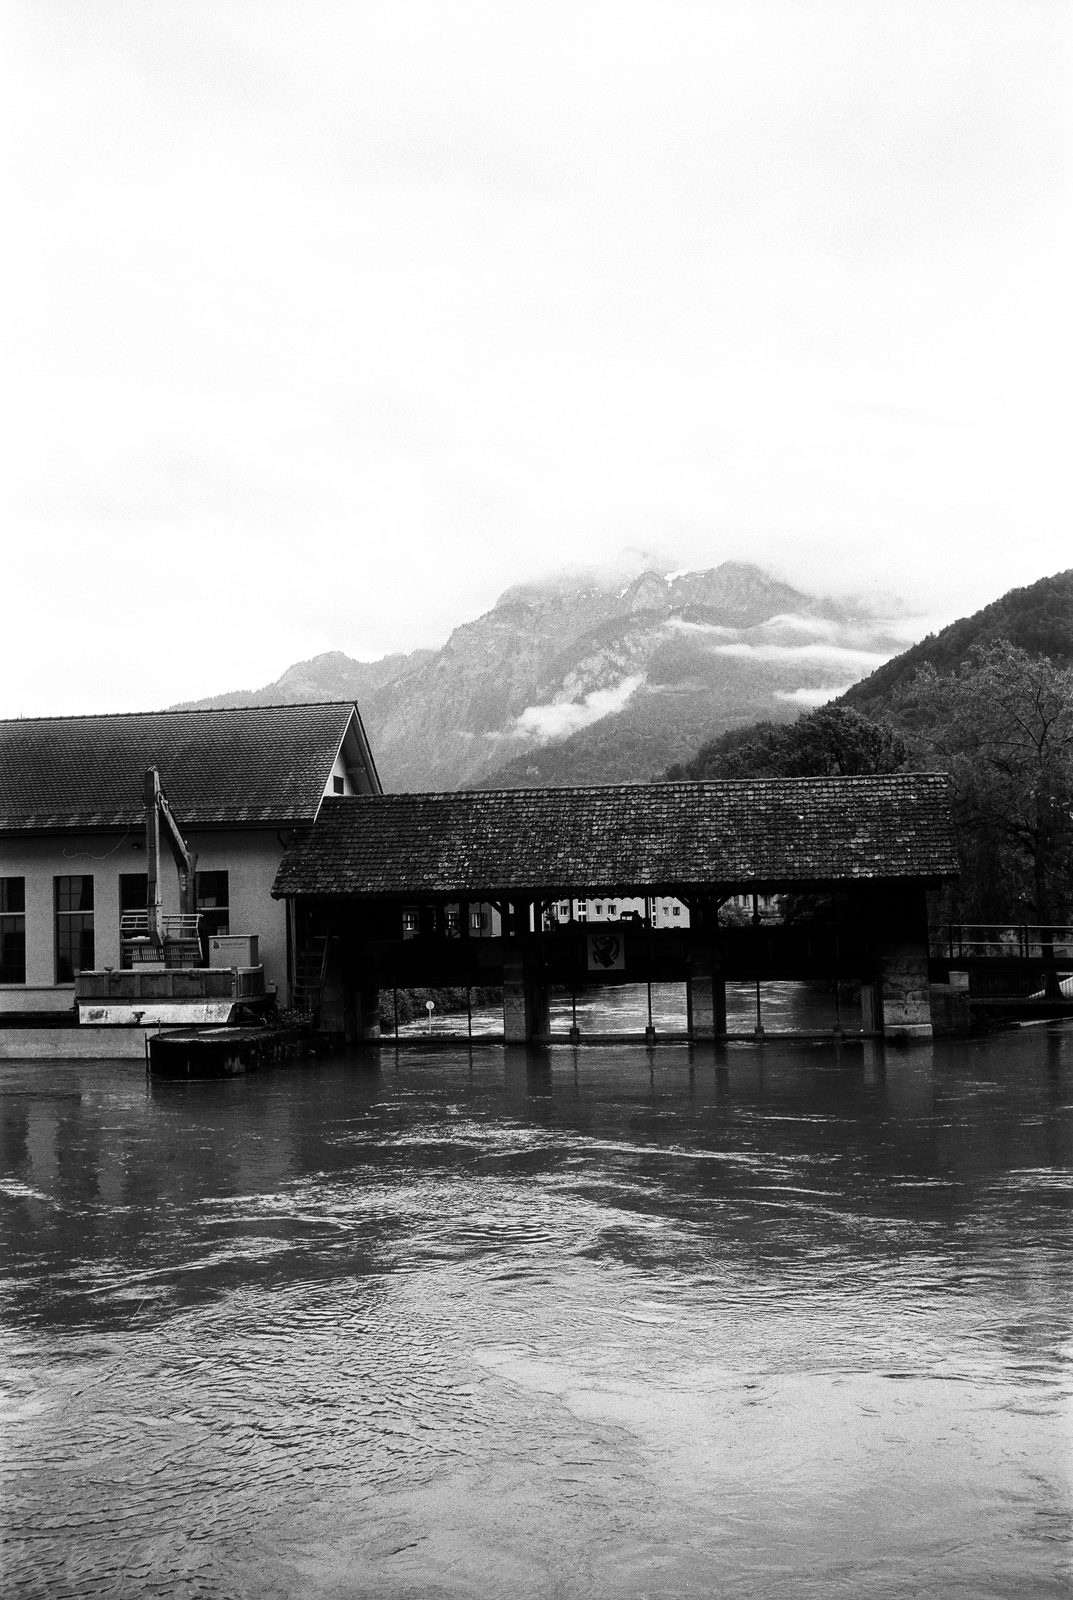
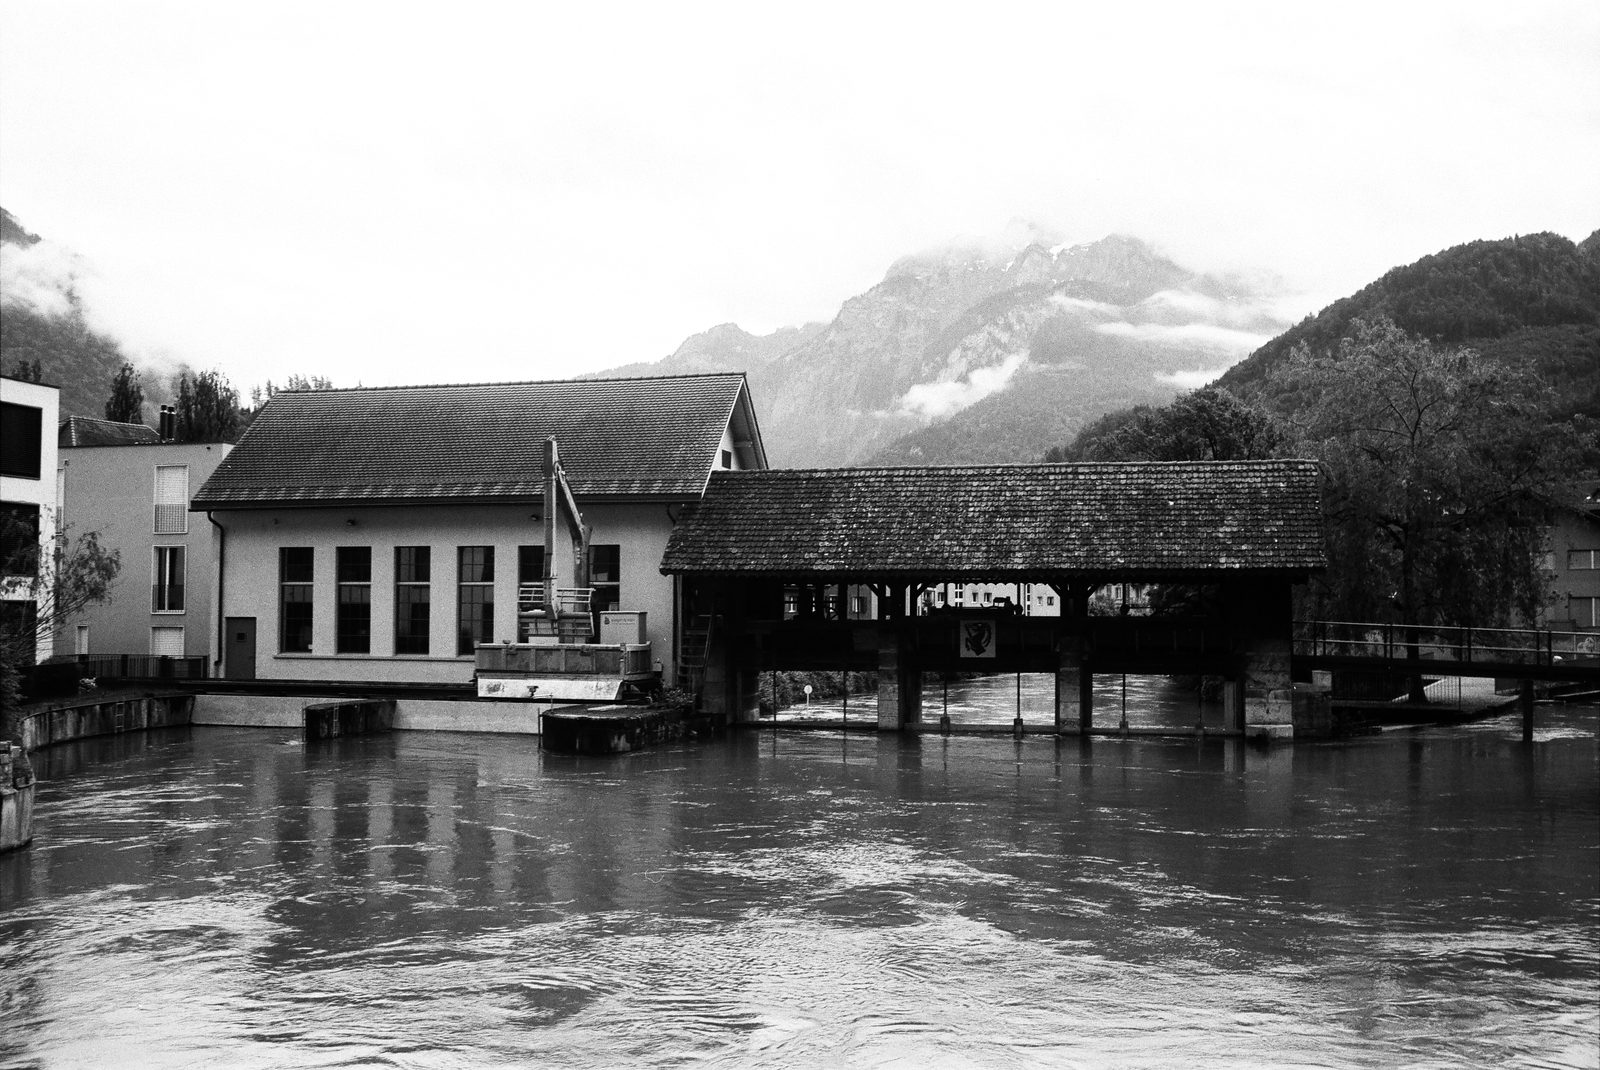
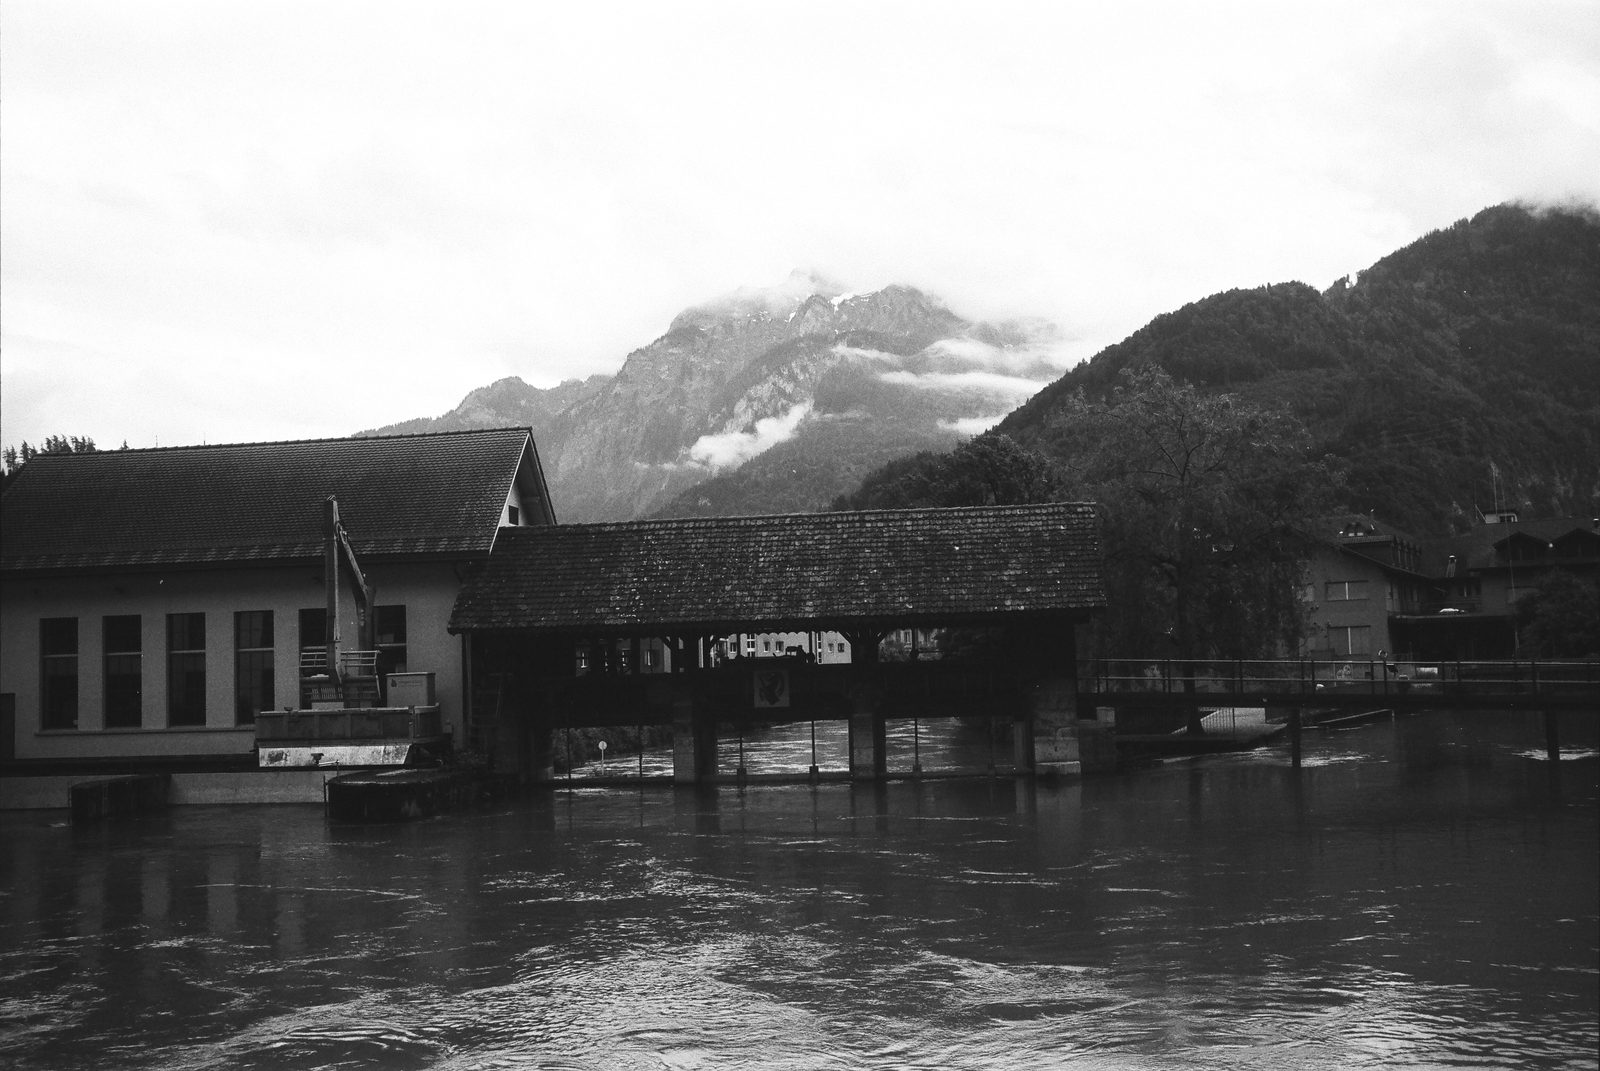
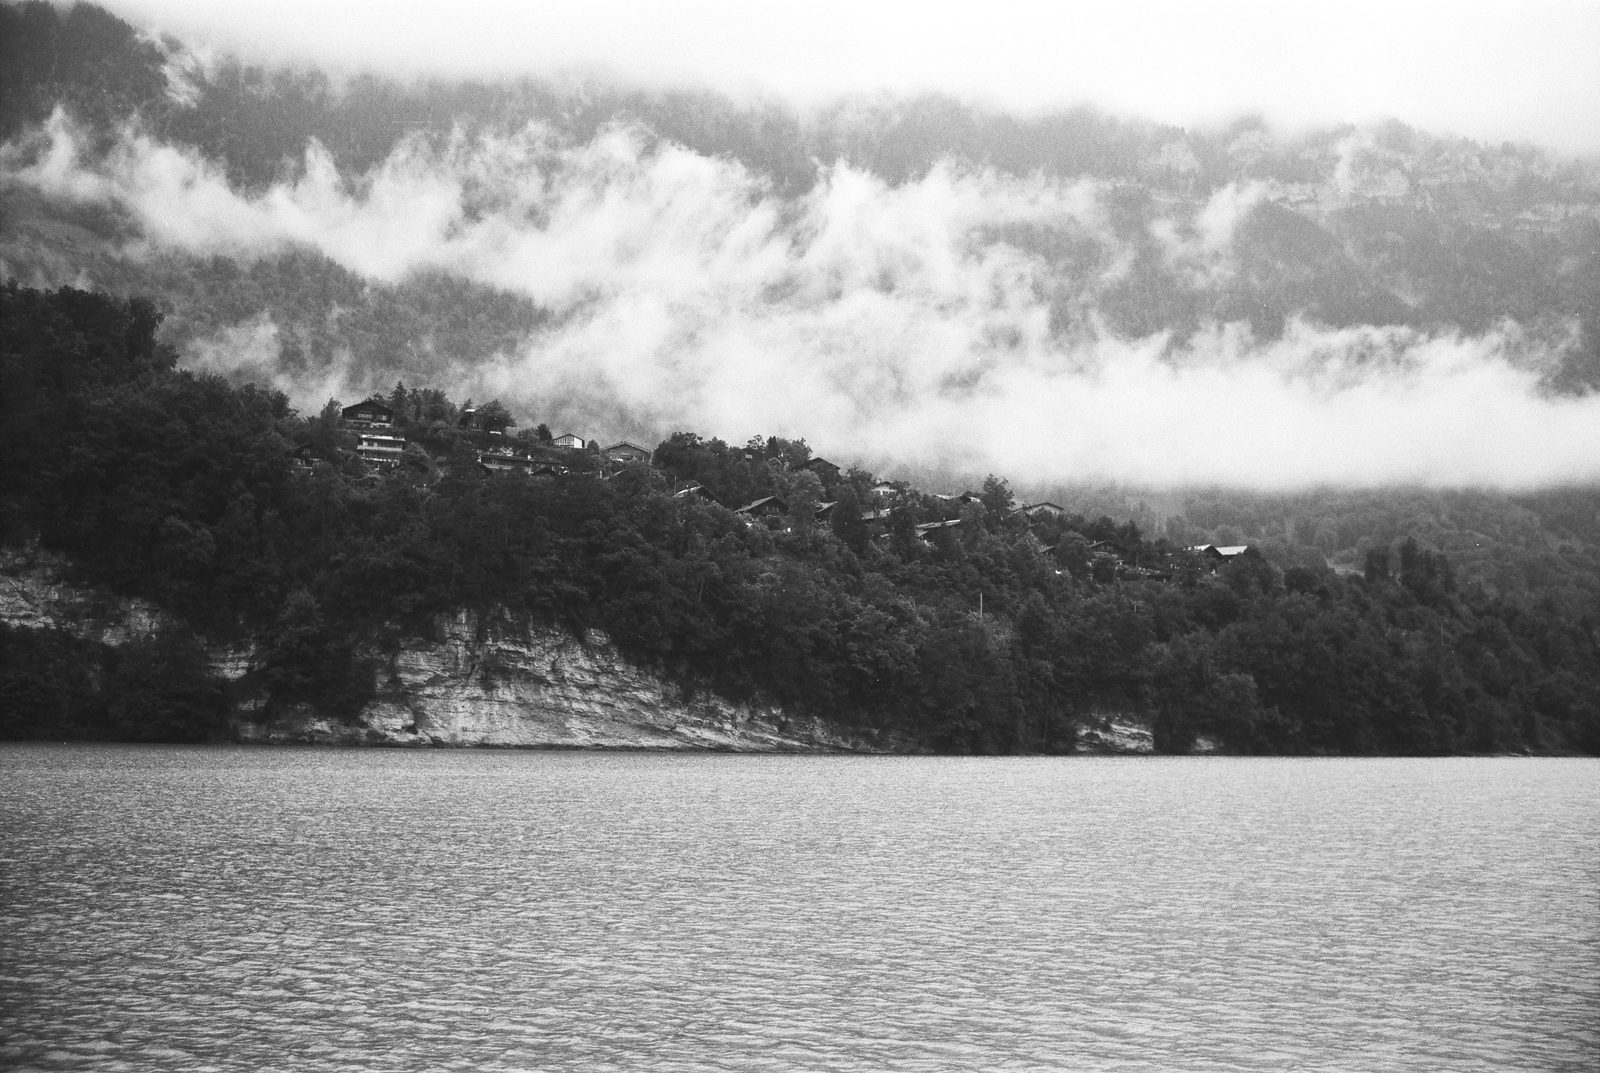
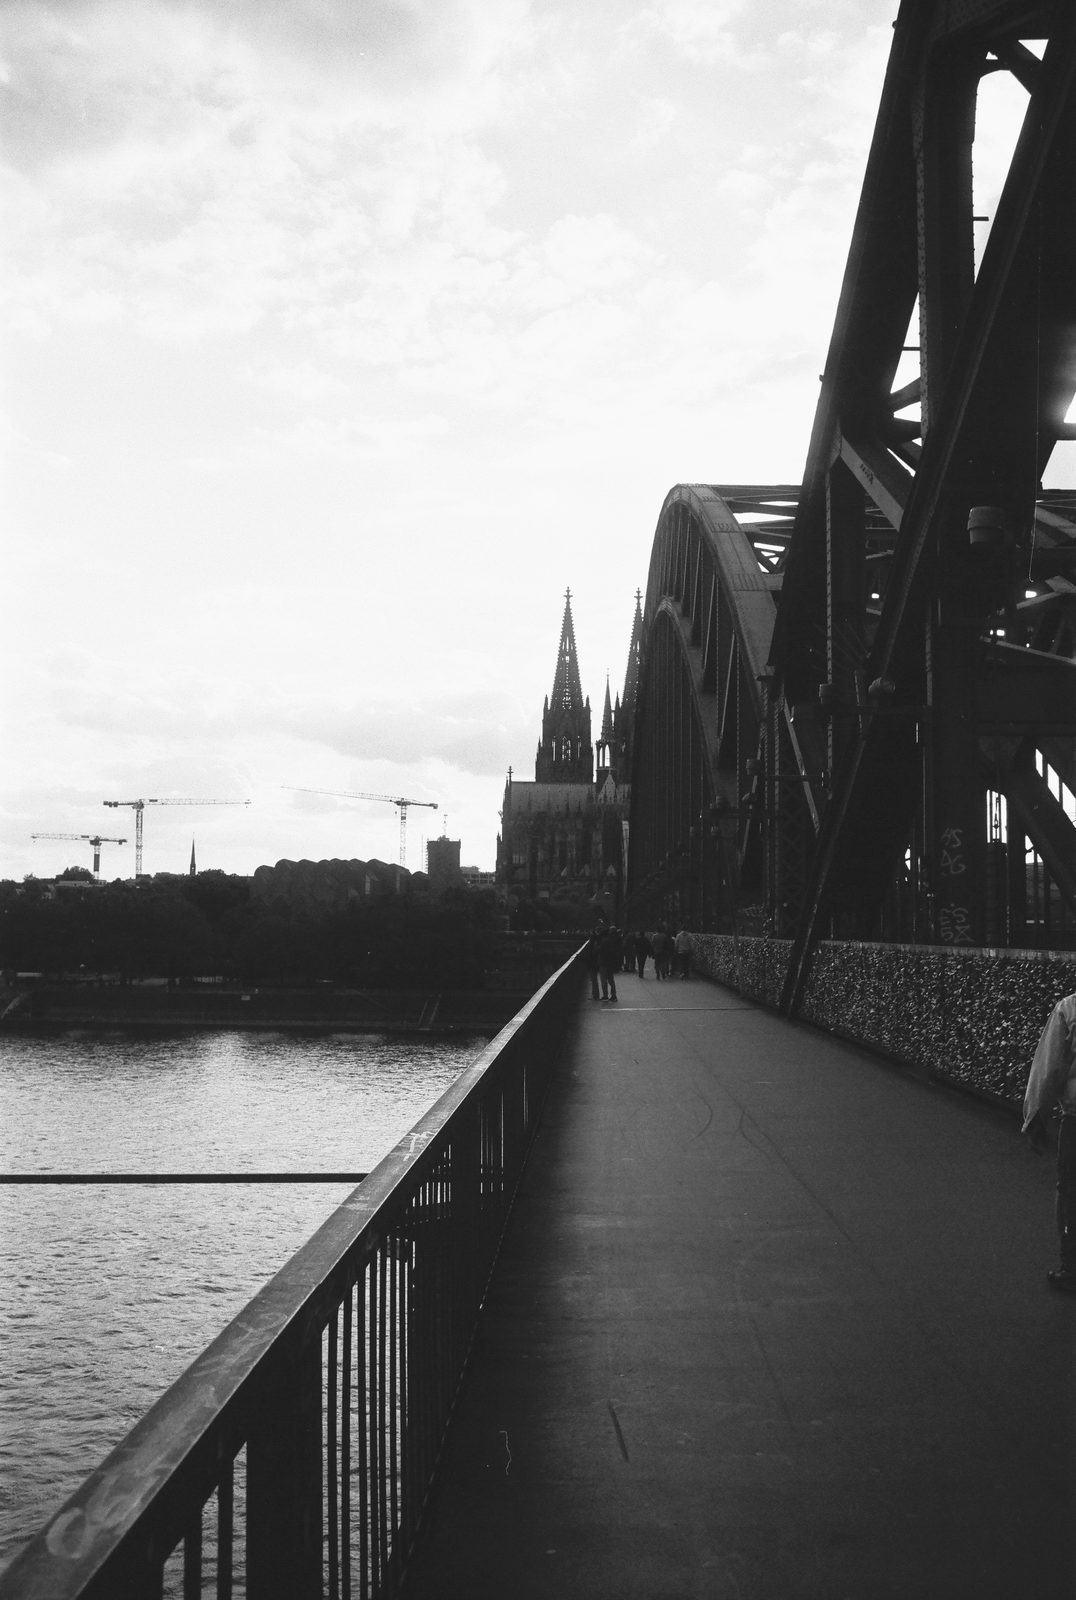
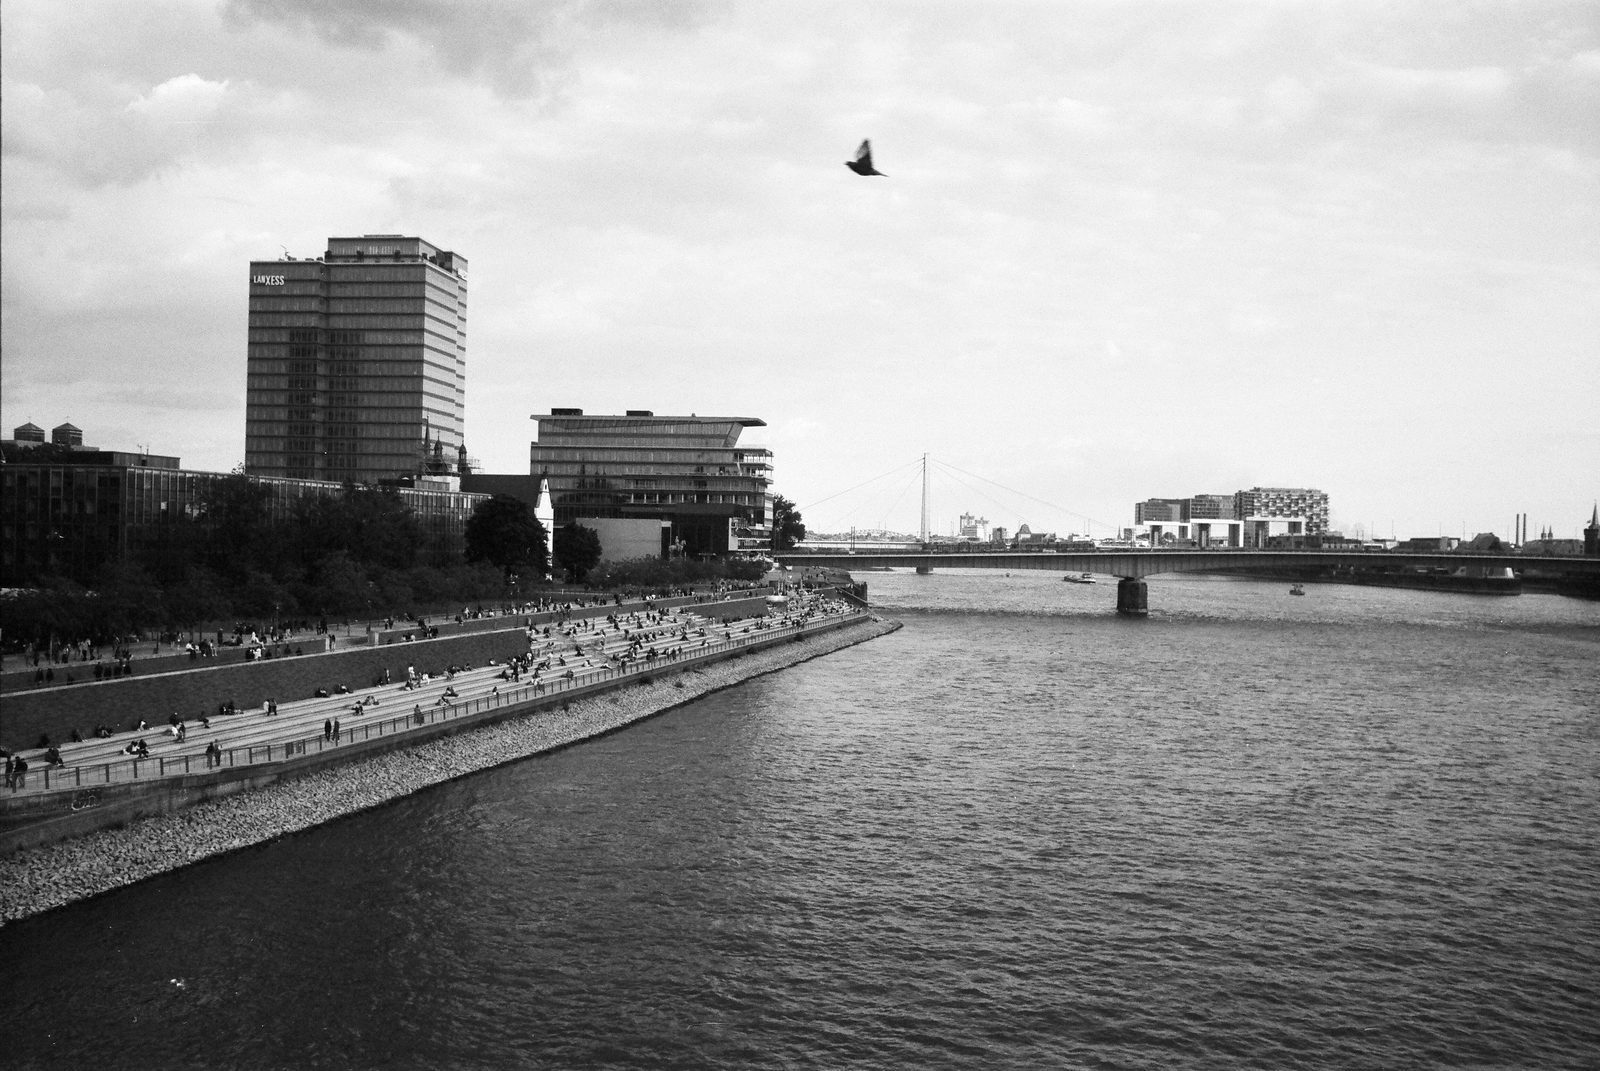
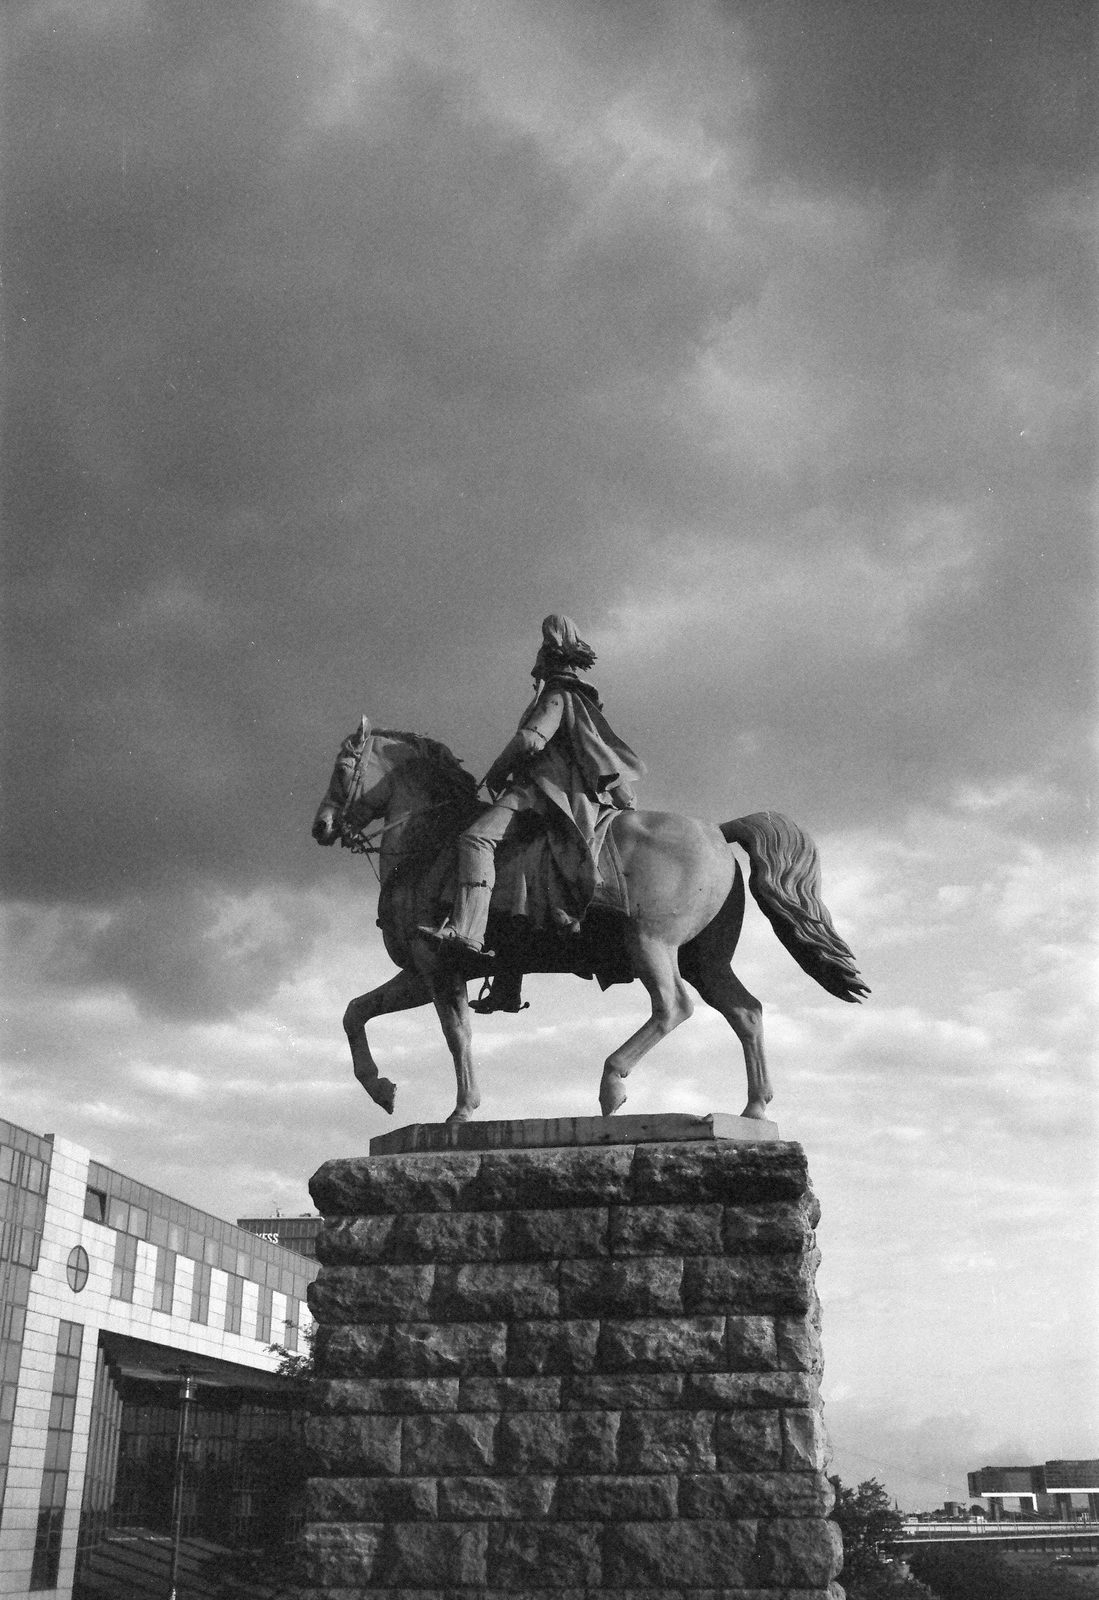
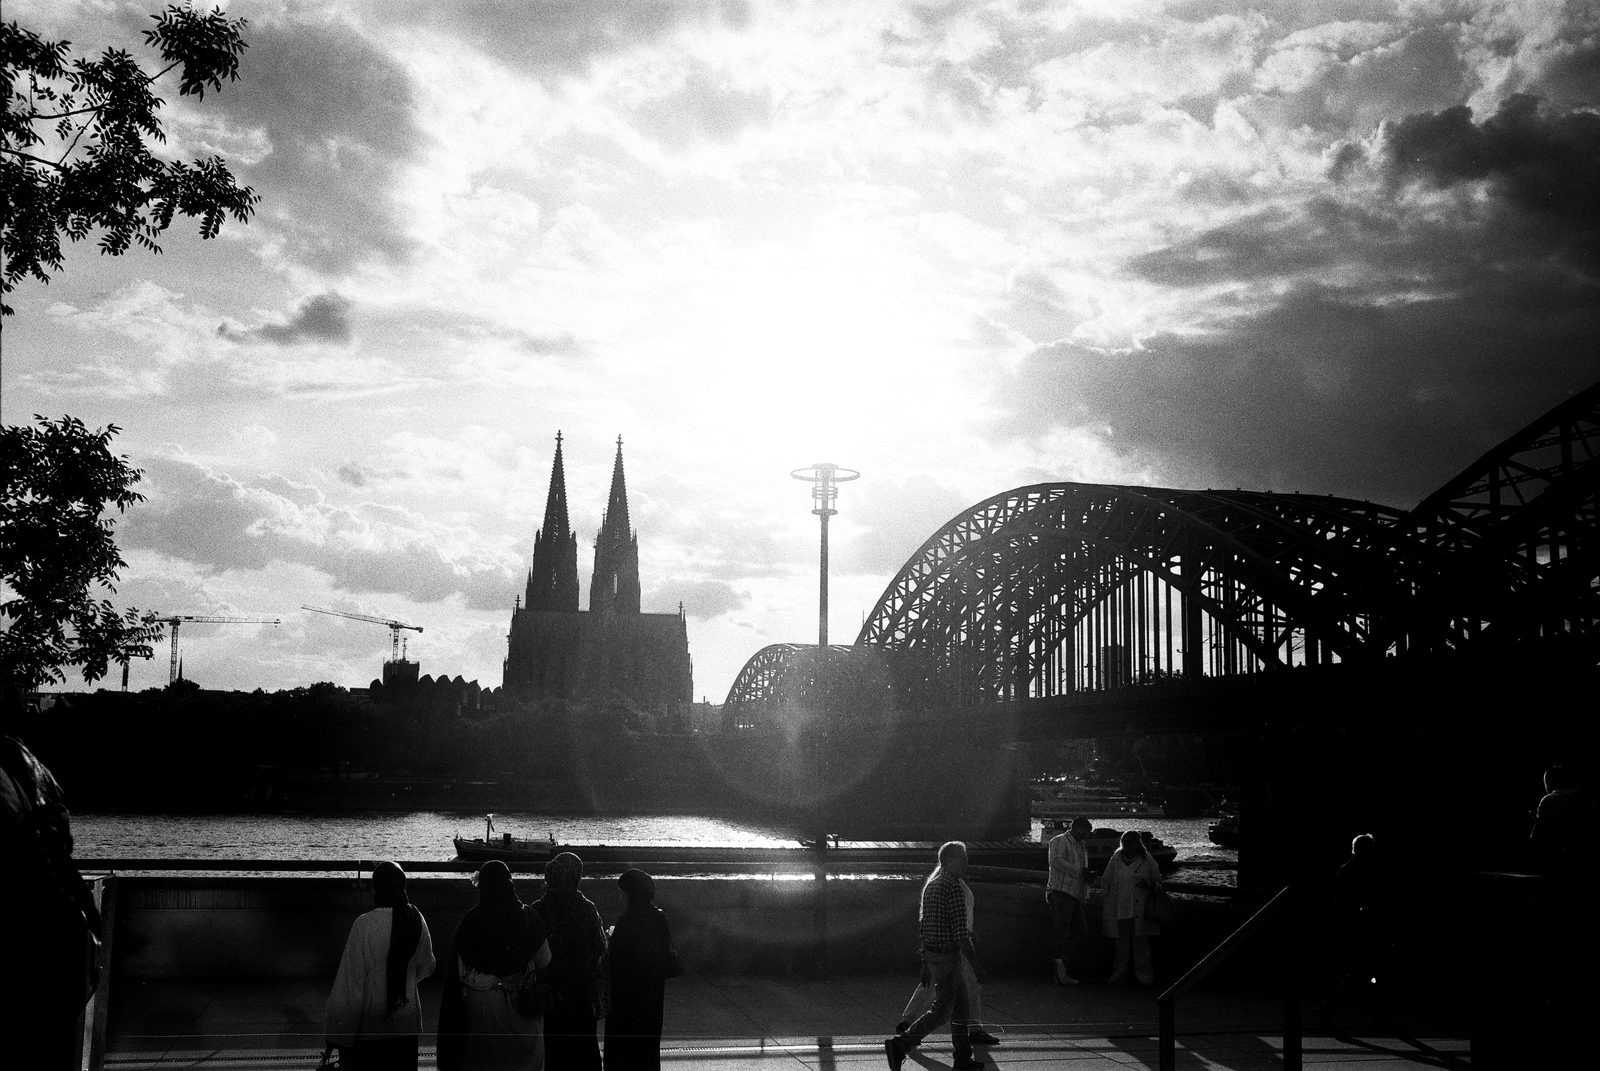
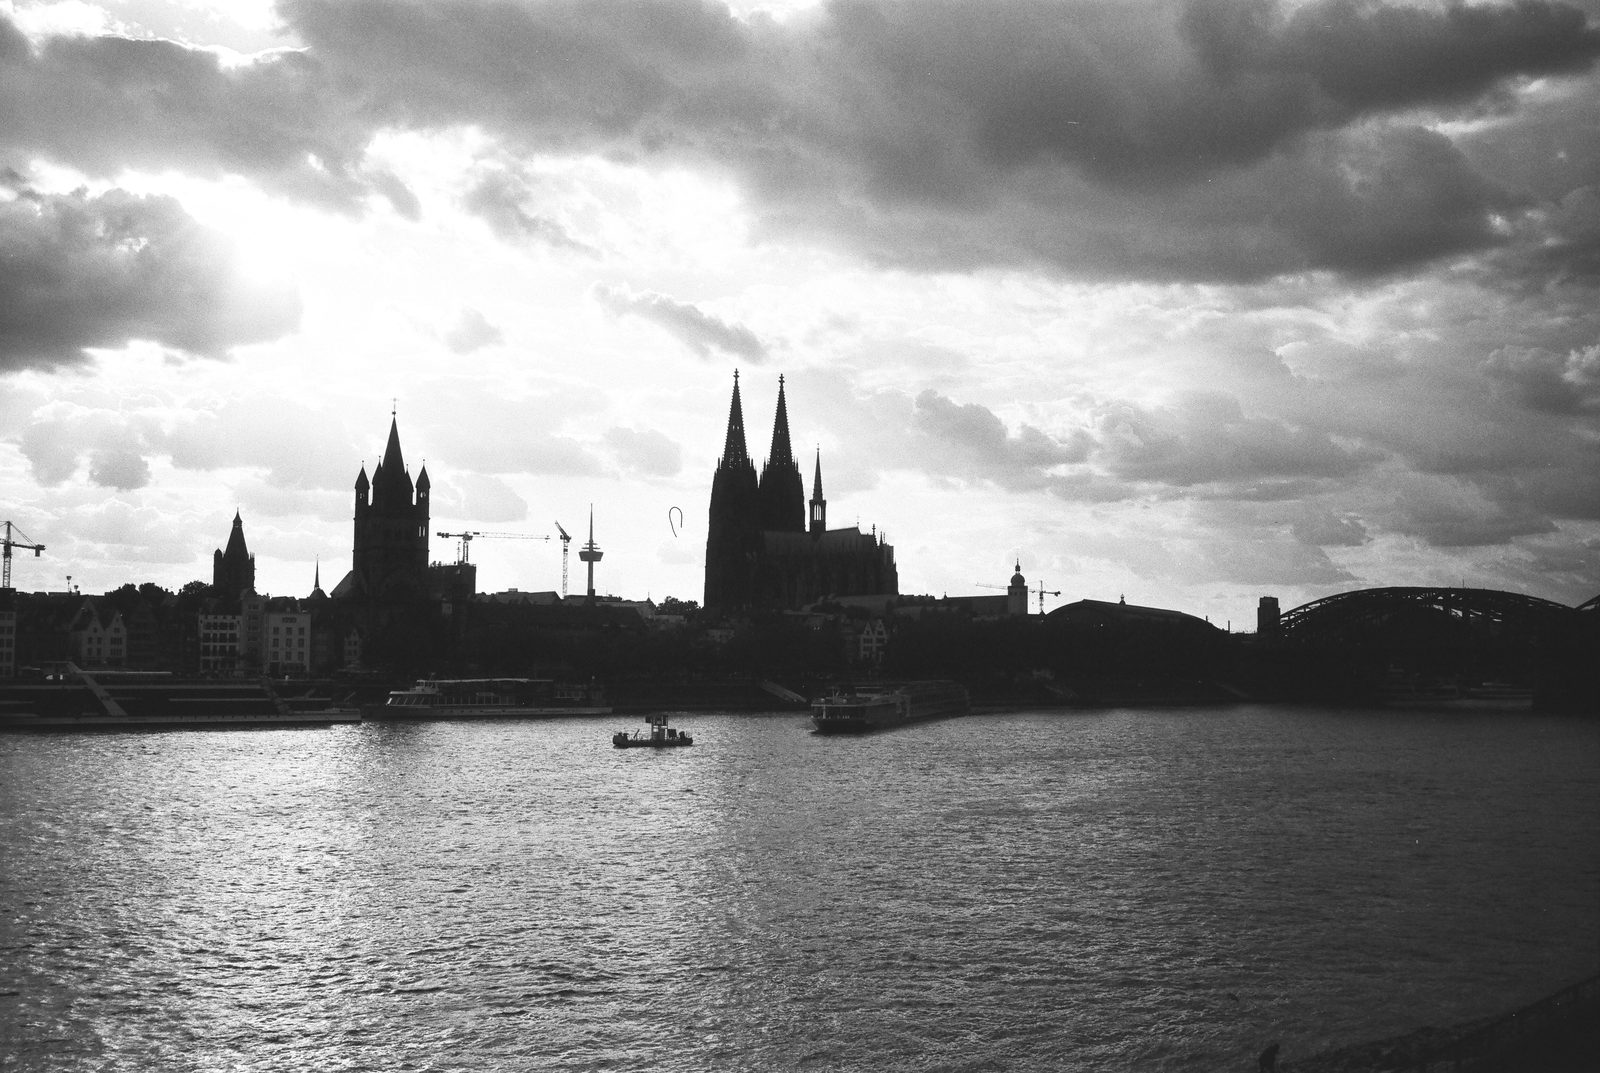
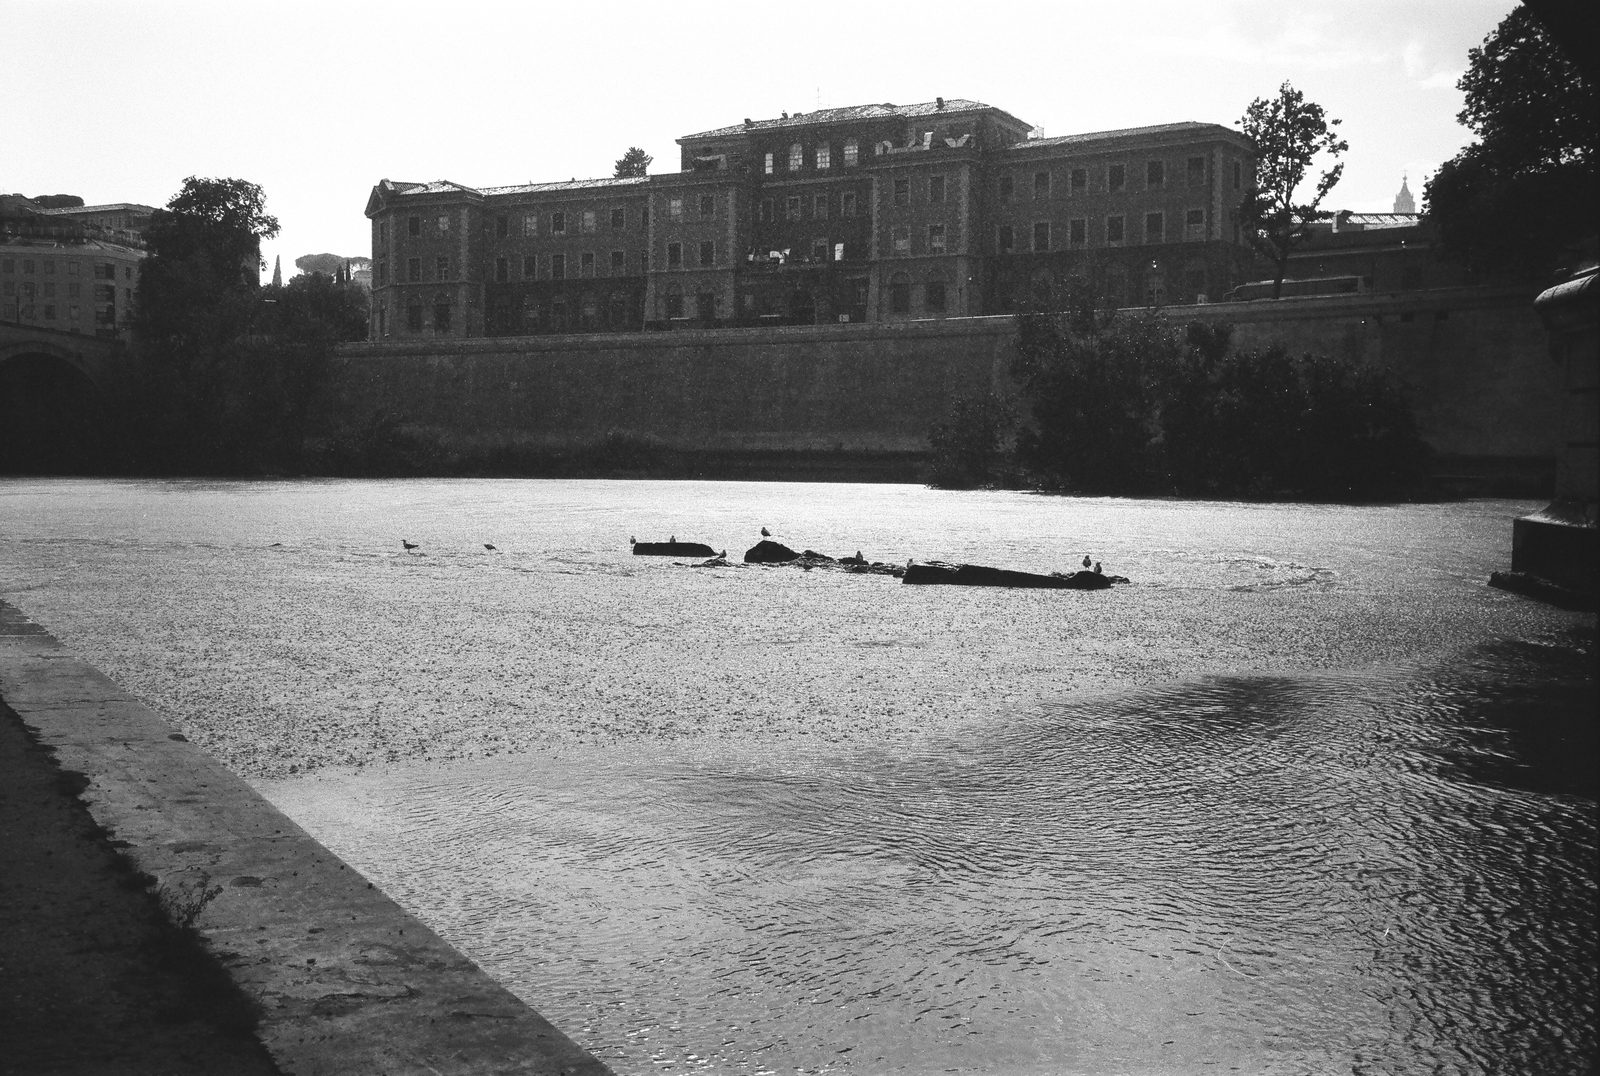
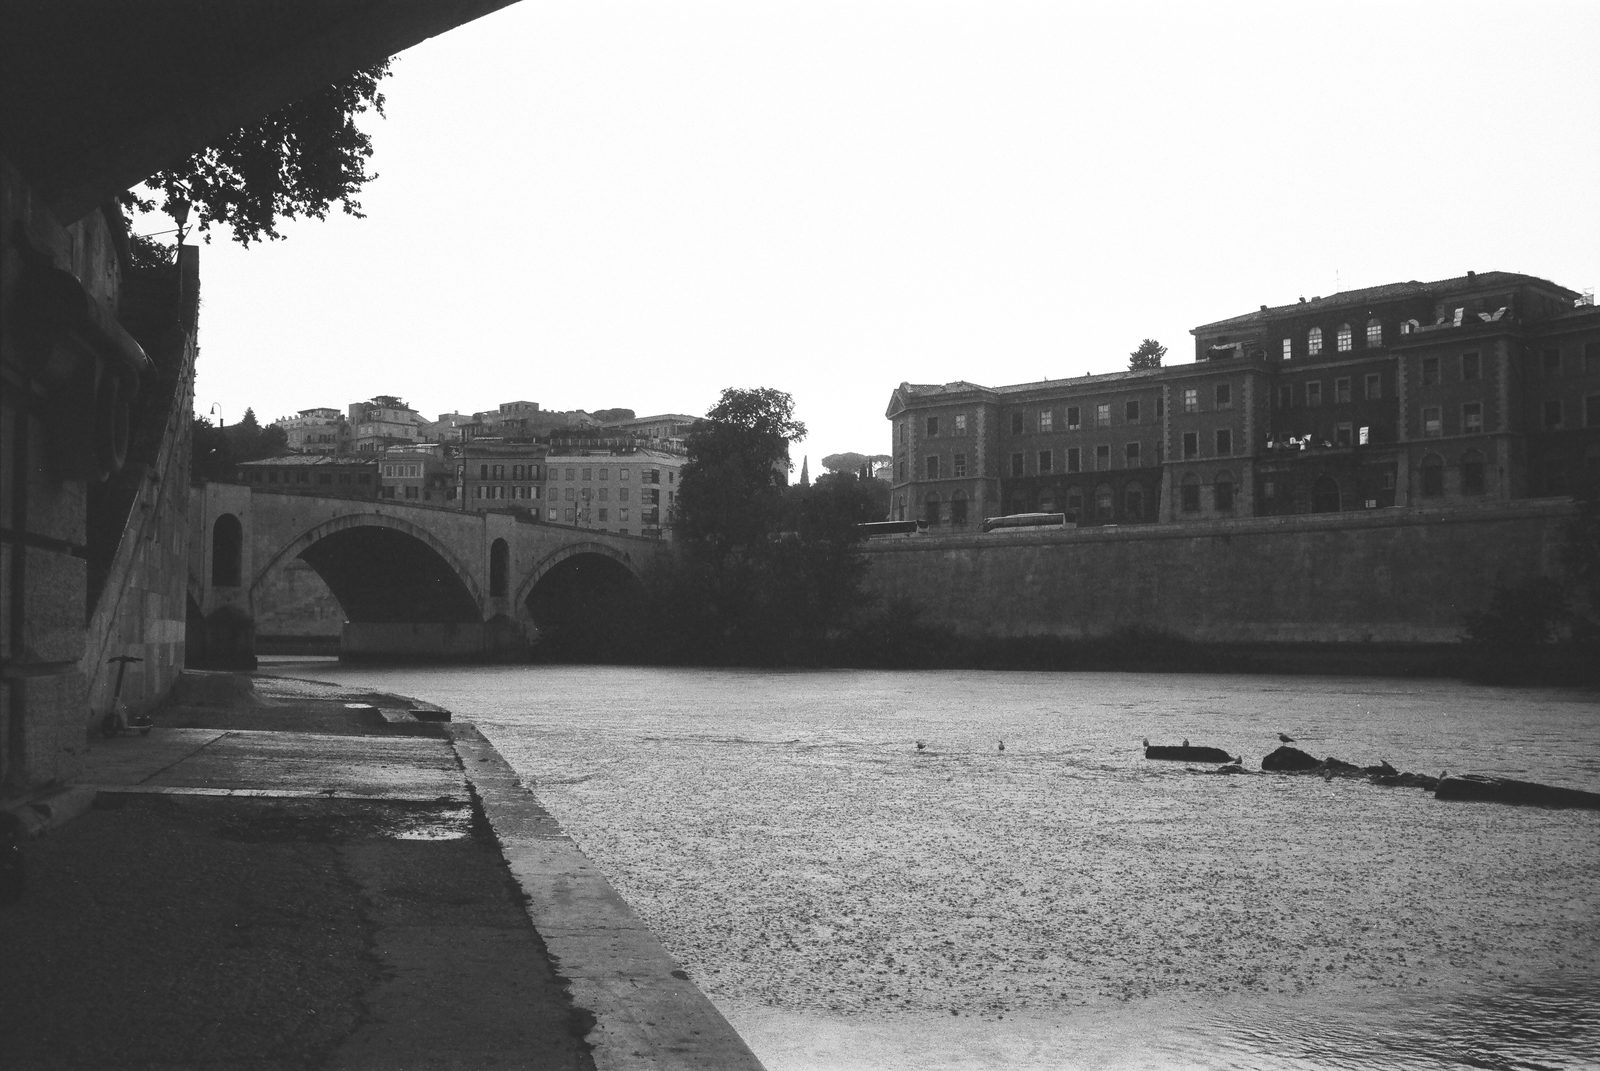
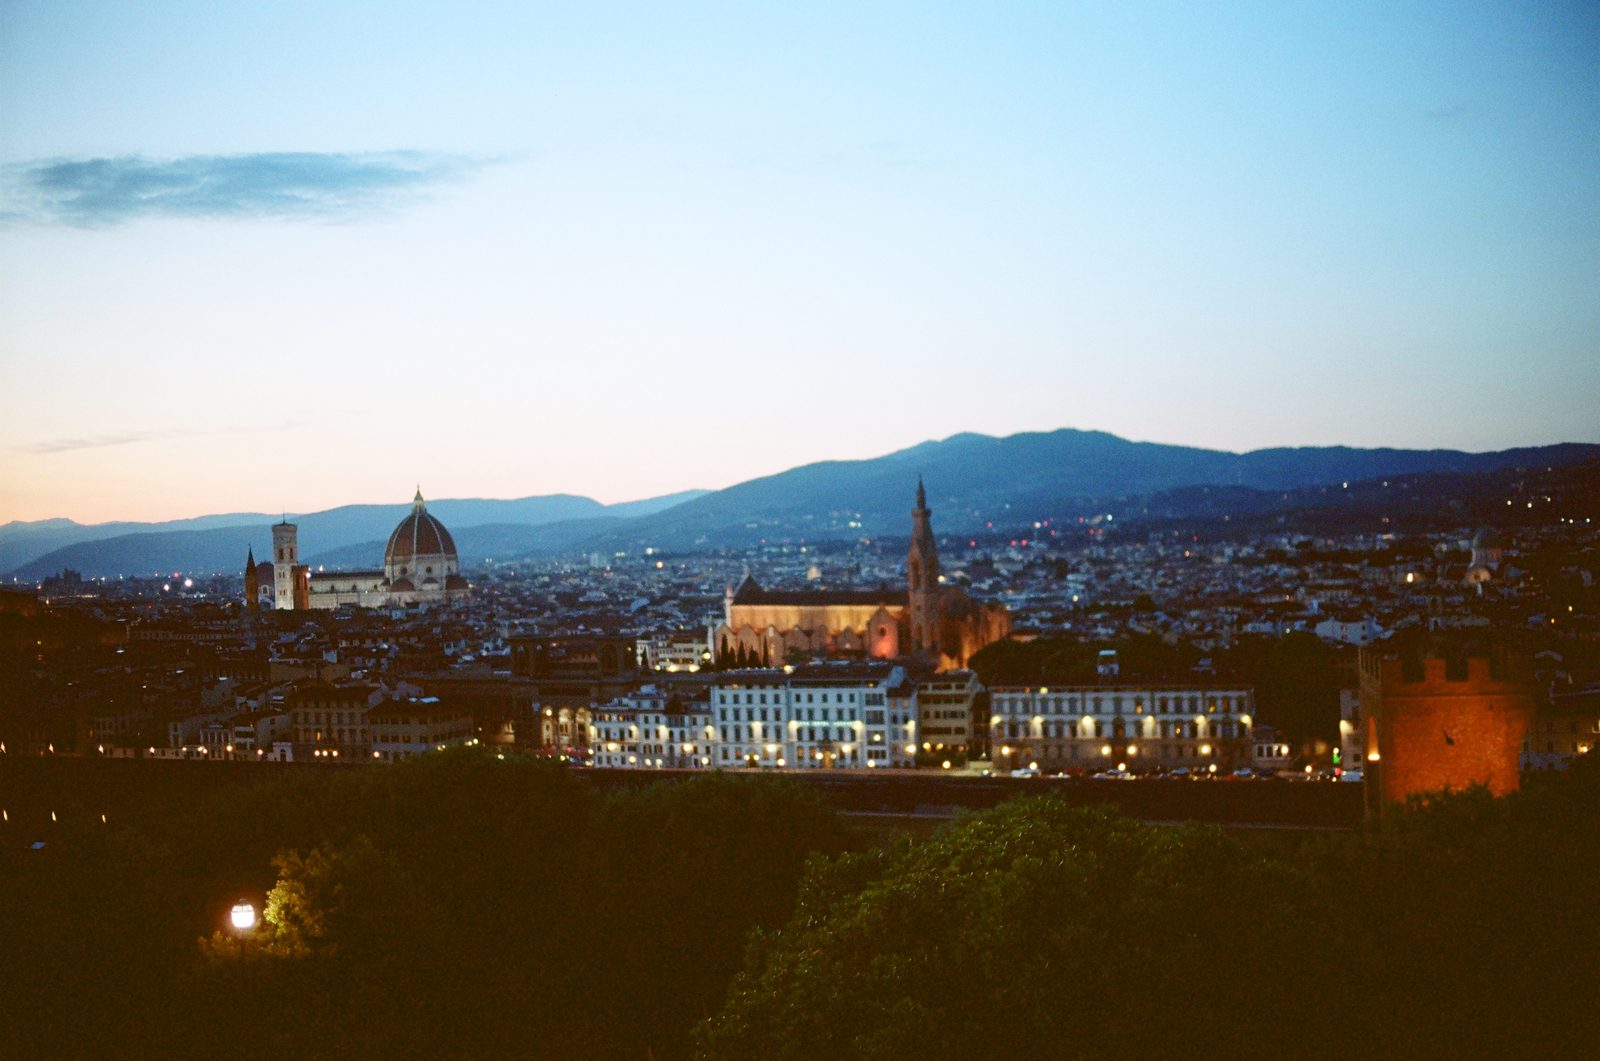
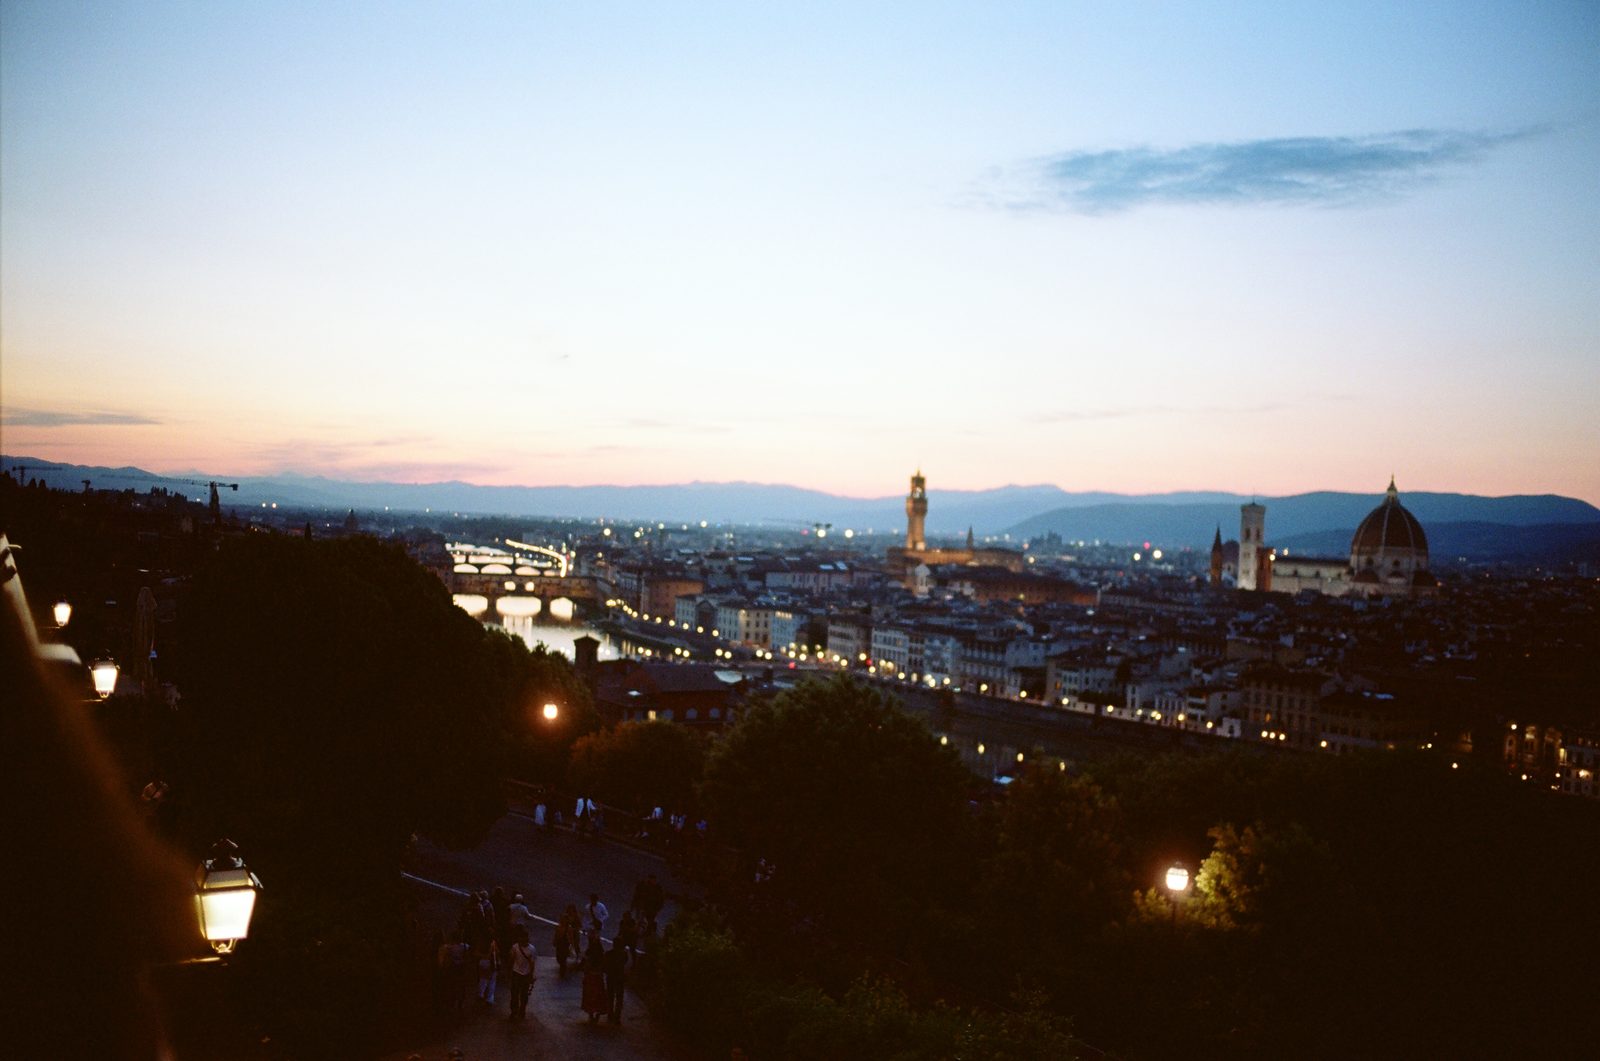
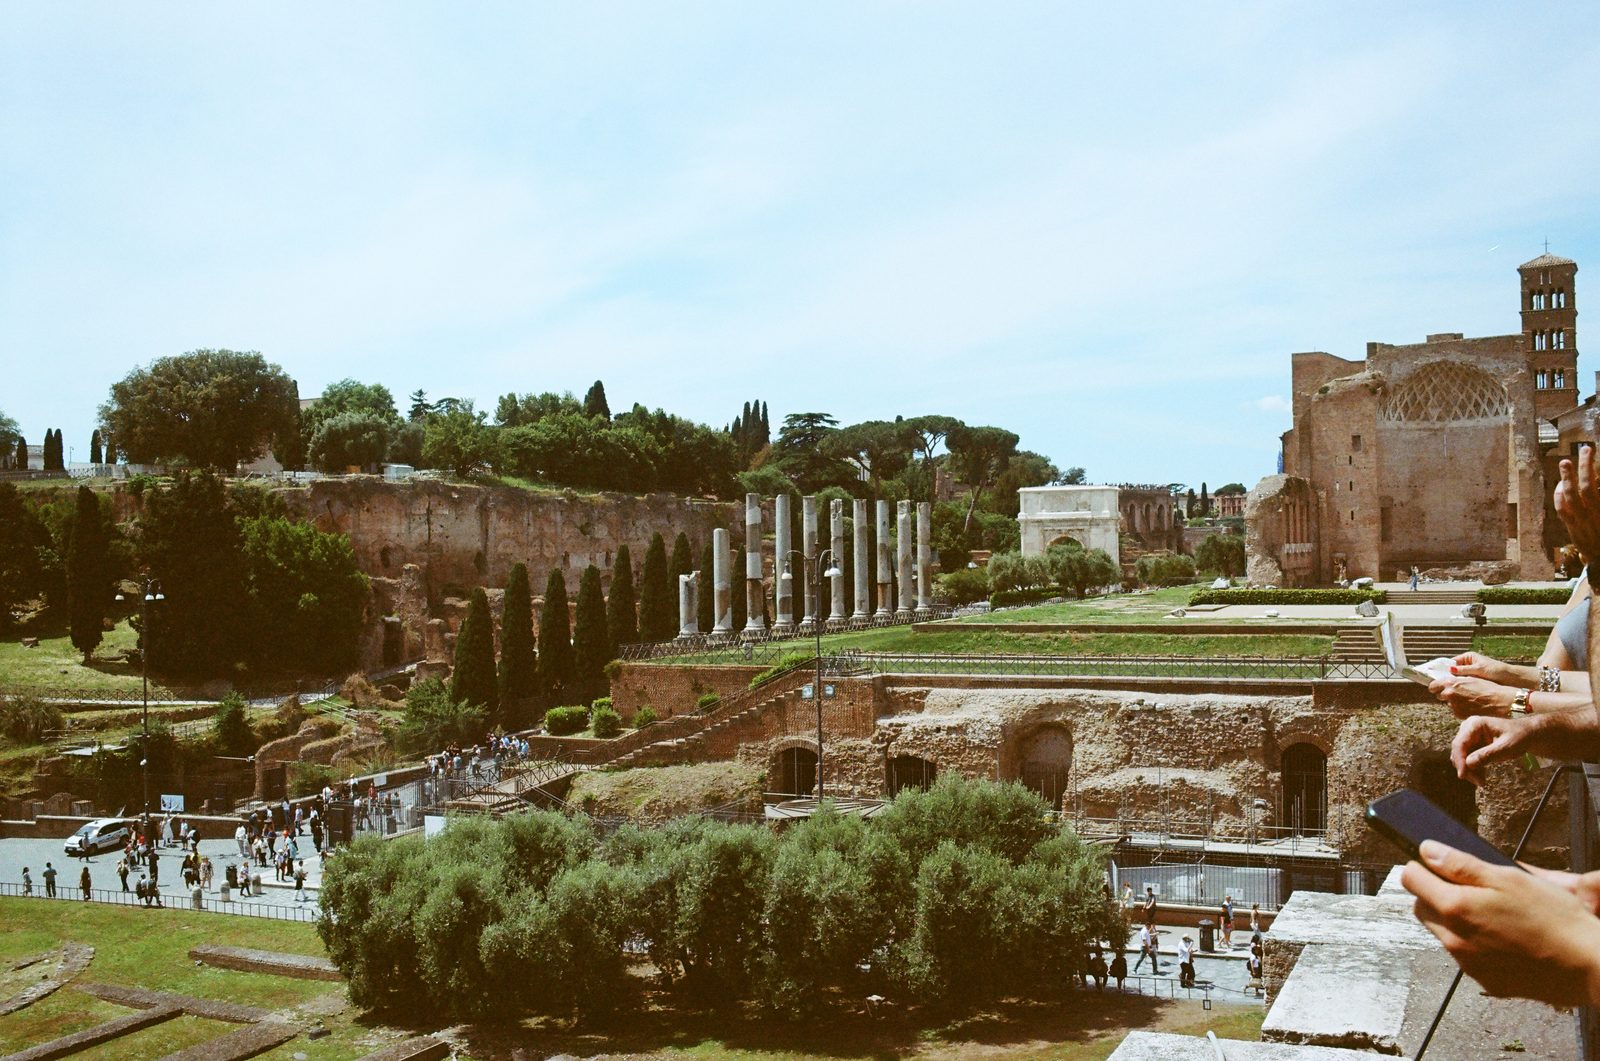
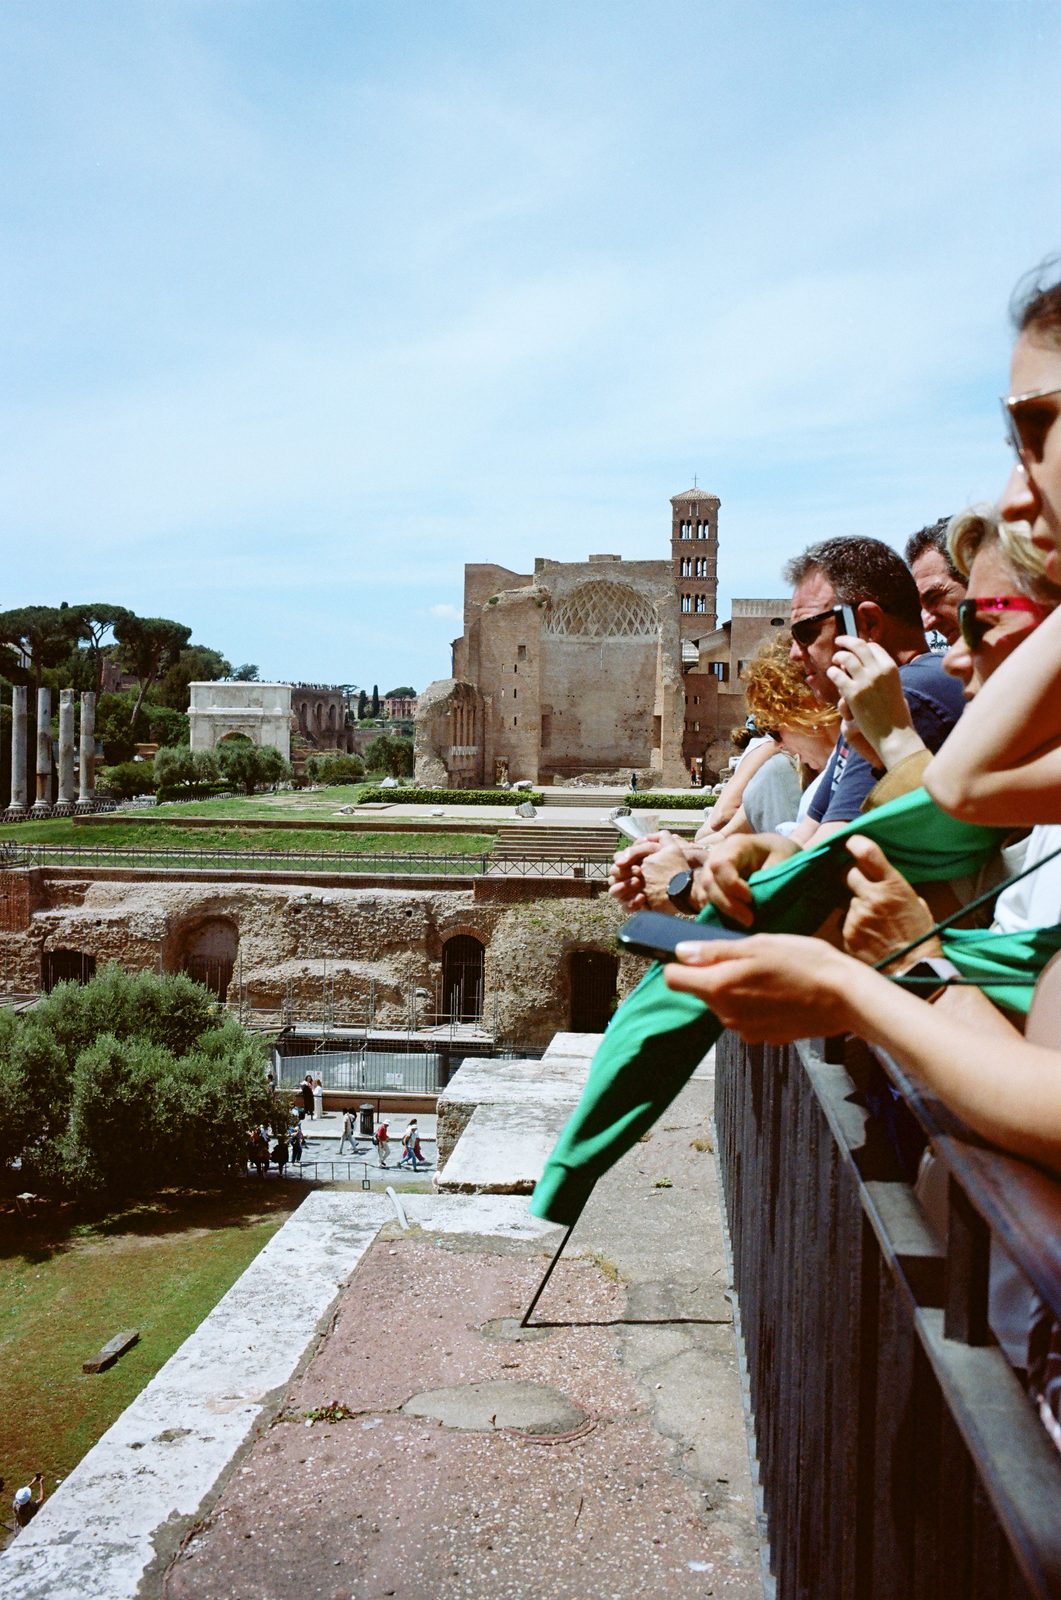
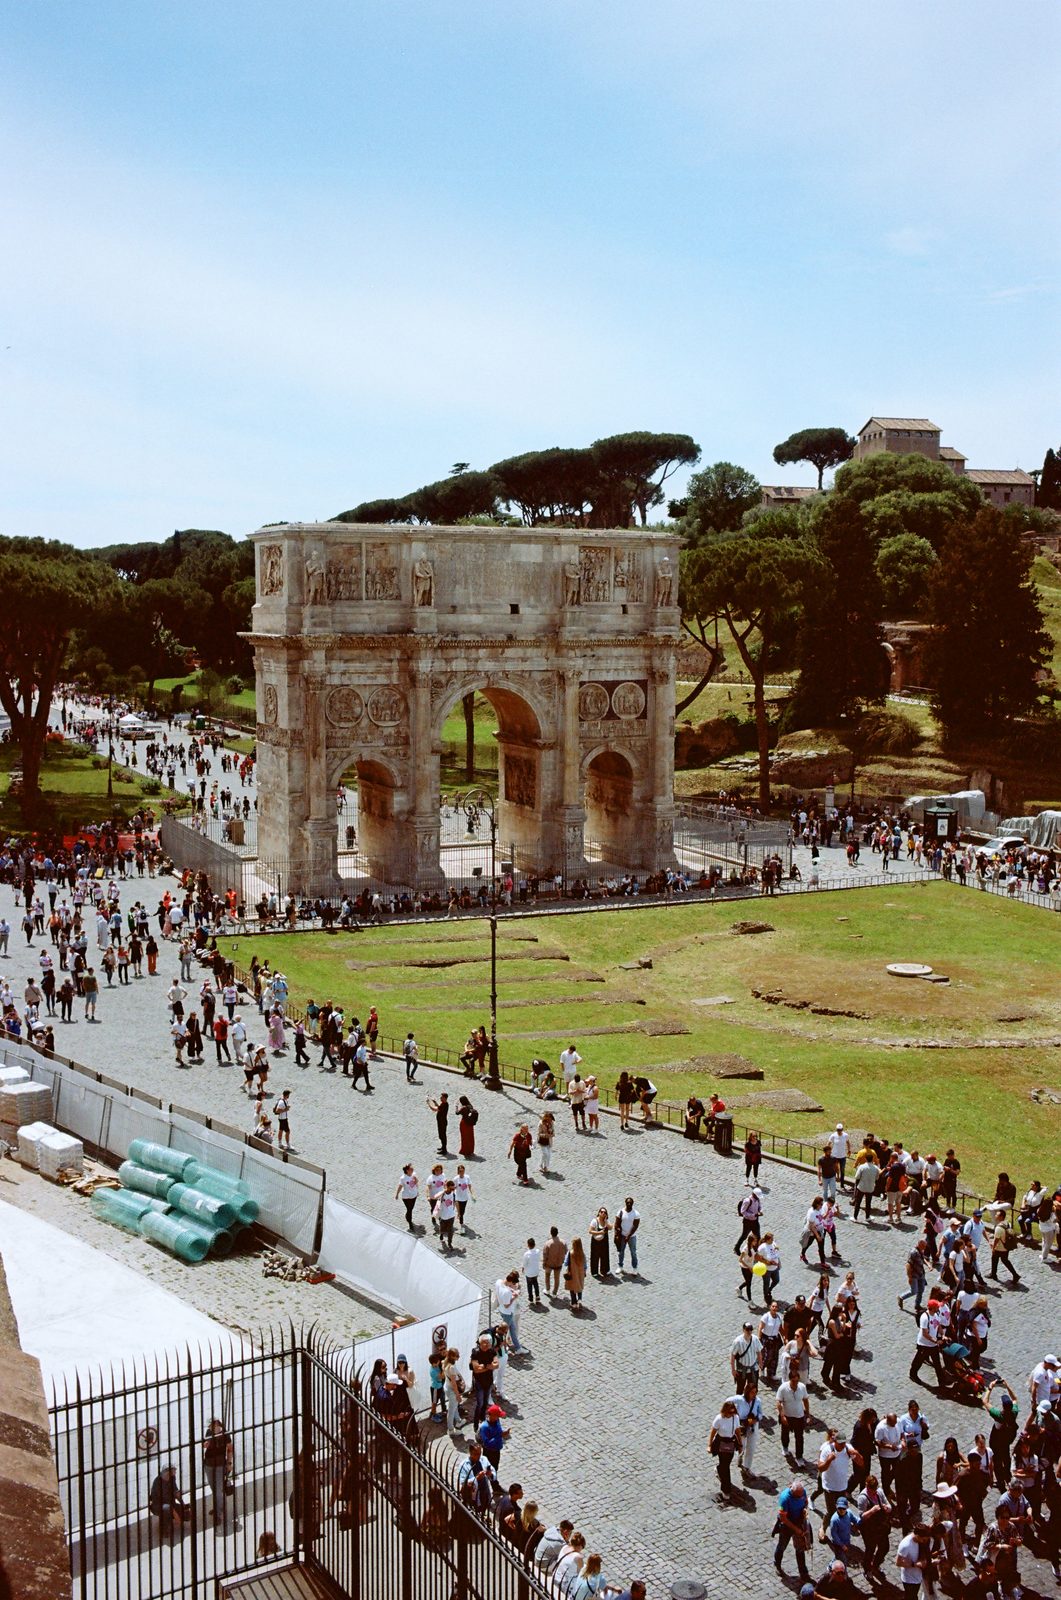
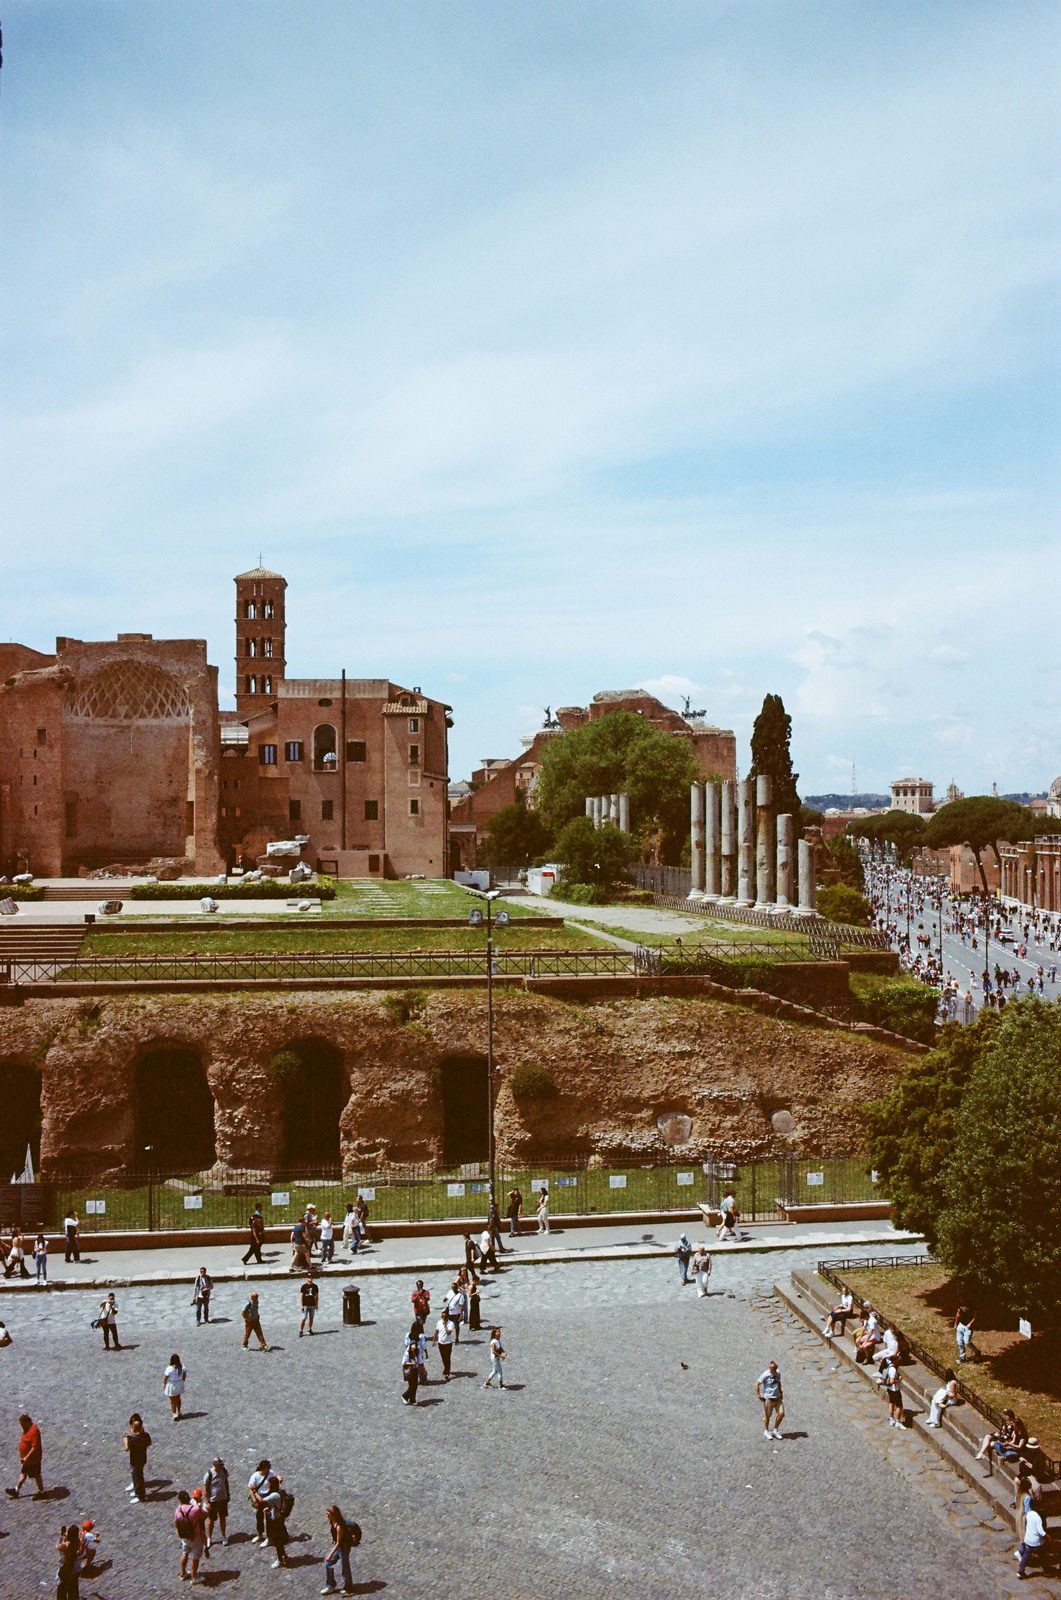
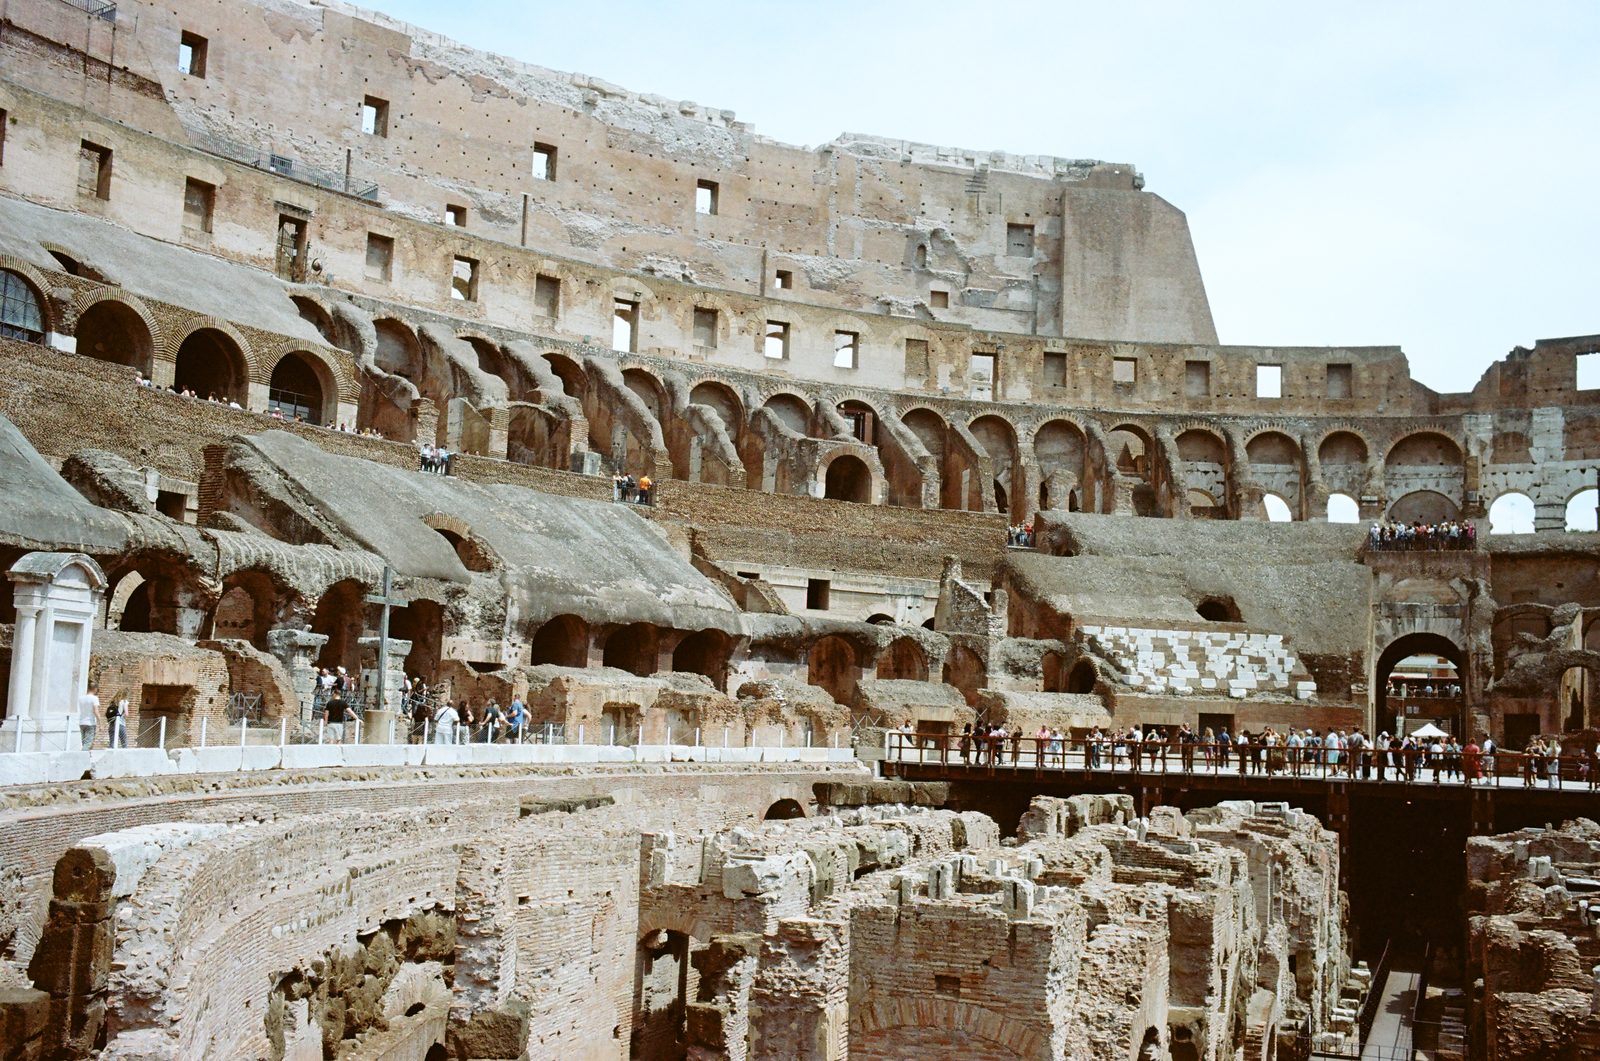
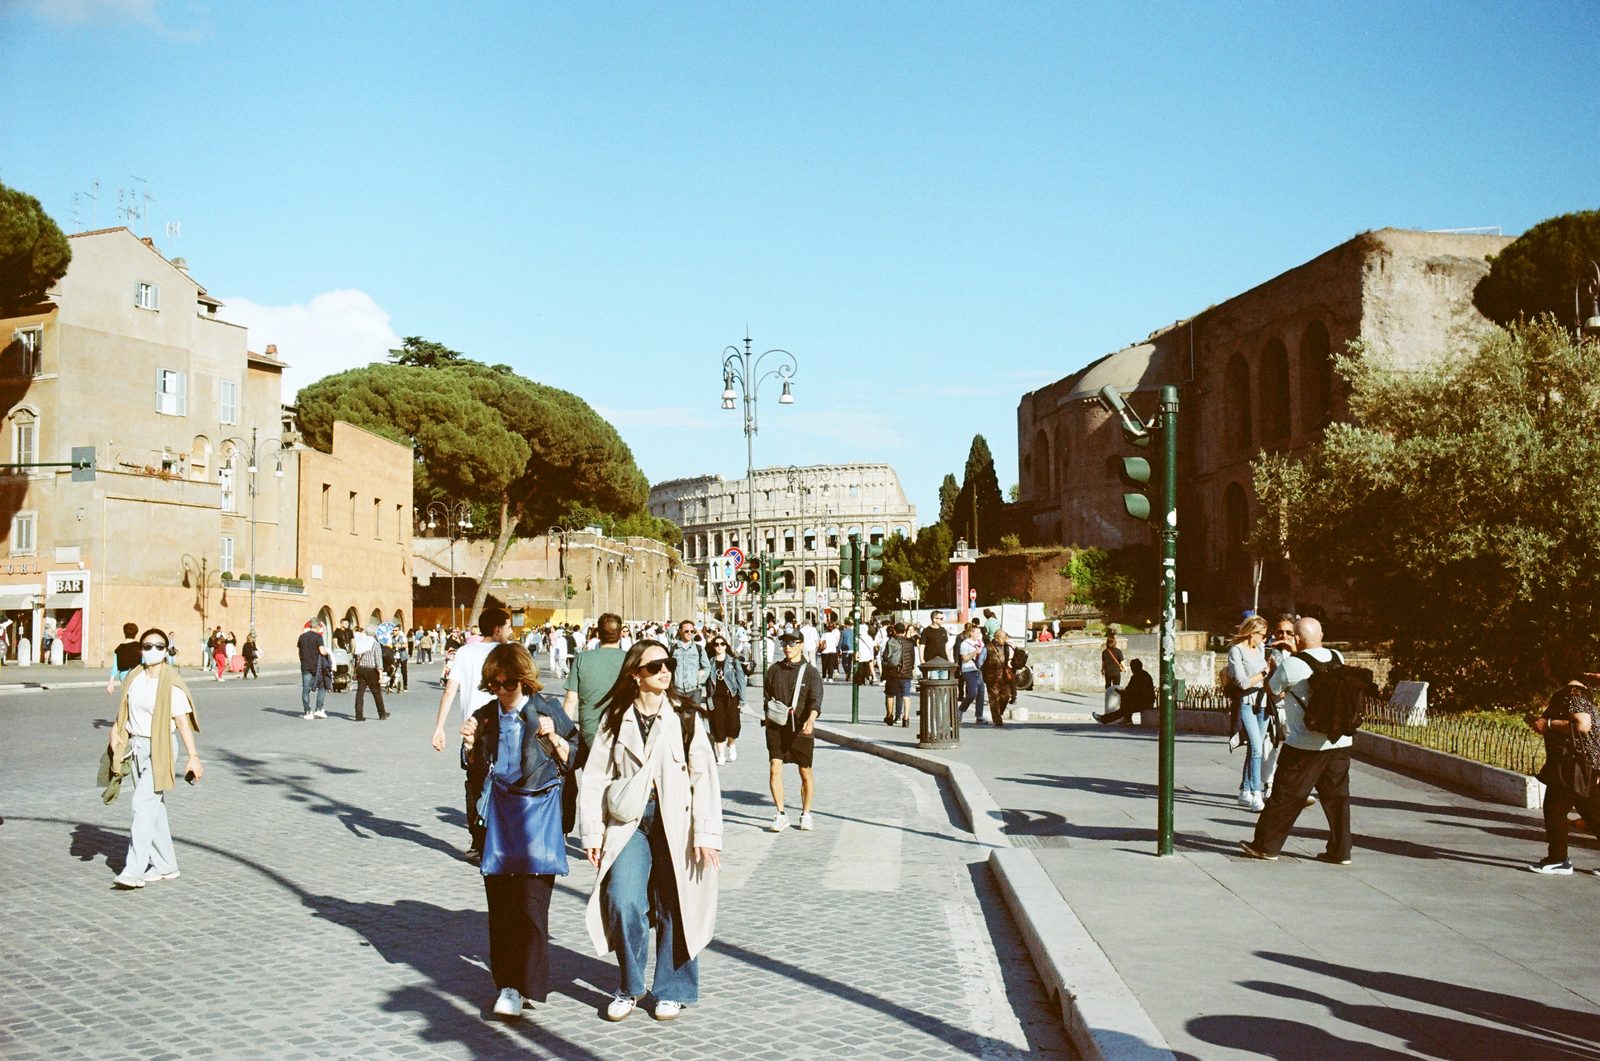
Film photography from Europe and Indiana, 2025.
2025年欧洲与印第安纳的胶片摄影。